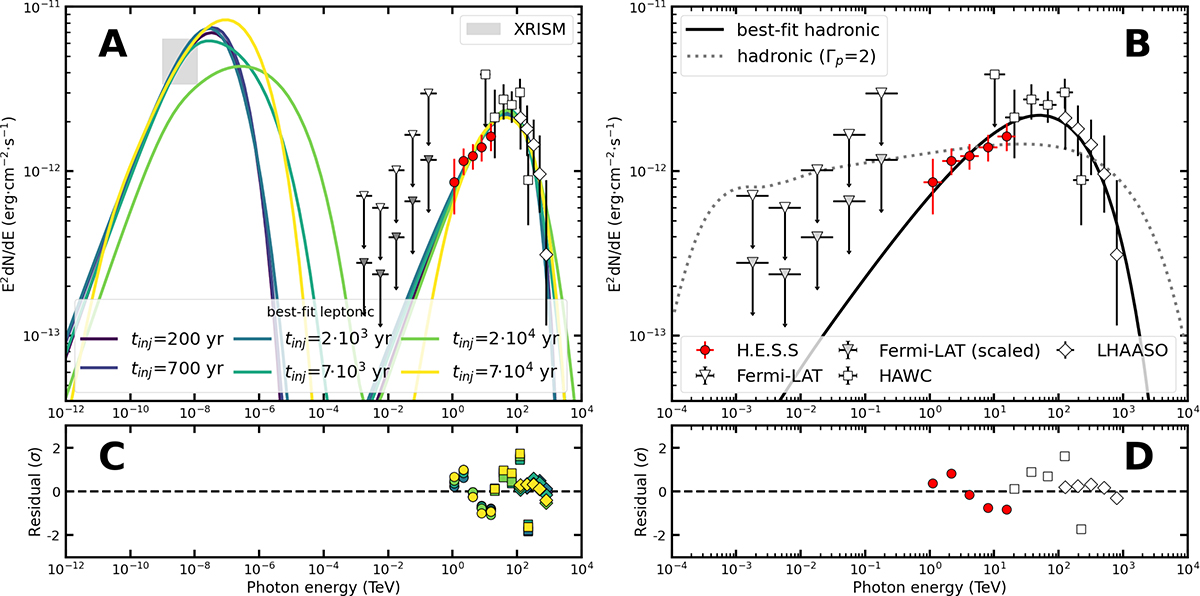
Fig. 8.
Download original image
Multi-wavelength SED and best-fit single-zones models. Panel A: The flux points and upper limits follow those of Figure 3. The XRISM flux region (scaled to the H.E.S.S. emission region size) is depicted with a grey shaded region. The Fermi-LAT points are shown both as published in Zhao et al. (2025) (light triangles) and re-scaled to the H.E.S.S. emission region size (dark triangles). The solid lines show the prediction of the best-fit leptonic model for different assumptions of tinj. Panel B: The flux point symbols follow those of panel A. The black solid line shows the prediction of the best-fit hadronic model. The model obtained by fitting with a fixed Γp = 2 is shown with a grey dotted line for reference. Panels C and D: The residuals between the data and the best-fit models. In the leptonic case, colours indicate the model and symbols the dataset.
Current usage metrics show cumulative count of Article Views (full-text article views including HTML views, PDF and ePub downloads, according to the available data) and Abstracts Views on Vision4Press platform.
Data correspond to usage on the plateform after 2015. The current usage metrics is available 48-96 hours after online publication and is updated daily on week days.
Initial download of the metrics may take a while.