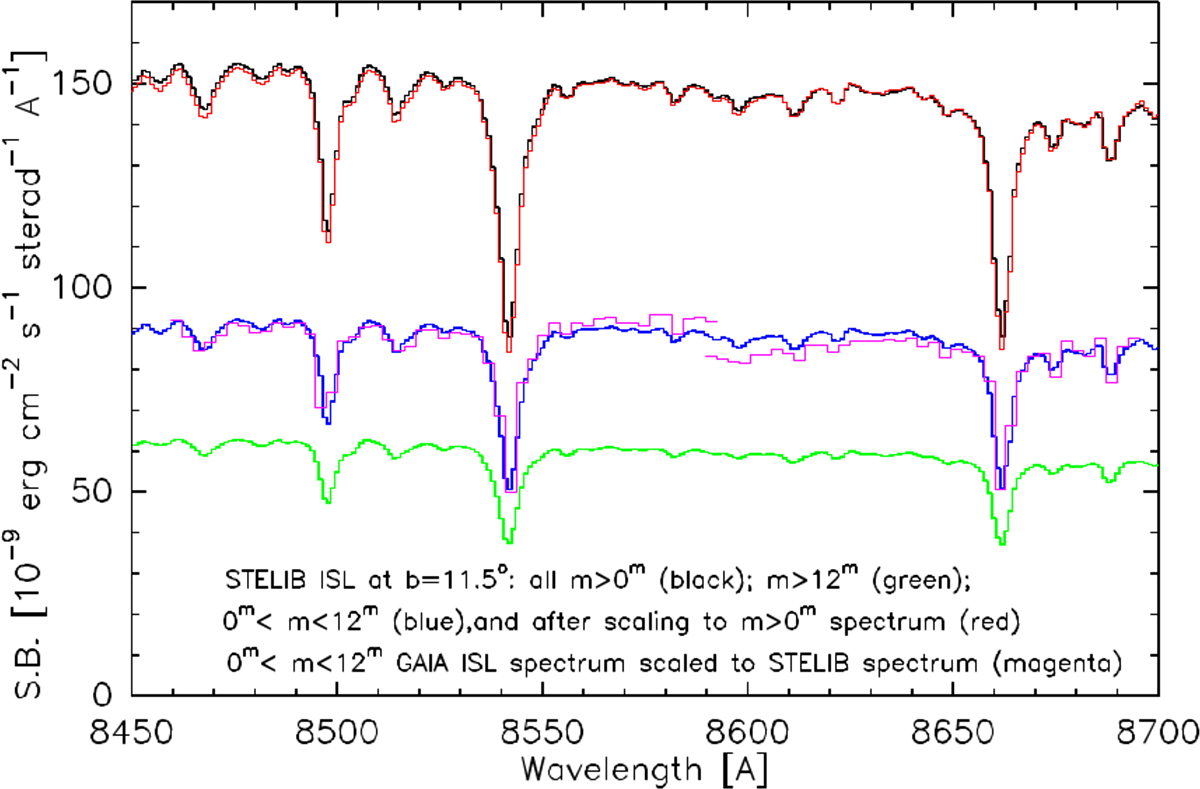
Fig. E.1.
Download original image
Synthetic ISL spectra based on the STELIB spectral library. The spectra are shown for different magnitude intervals: total starlight m > 0 mag (black); m > 12 mag (blue); 0 < m < 12 mag (green). In order to demonstrate the agreement between the total ISL and the 0 < m < 12 mag spectra, a scaled version of the latter (in red) is overplotted on the total spectrum. A suitably re-scaled GAIA/RVS spectrum is shown as the magenta line overplotted upon the model spectrum for 0 < m < 12 mag (blue line). Because of the difference in baseline slopes, the GAIA/RVS spectrum has been cut at 8590 Å and is shown as two pieces.
Current usage metrics show cumulative count of Article Views (full-text article views including HTML views, PDF and ePub downloads, according to the available data) and Abstracts Views on Vision4Press platform.
Data correspond to usage on the plateform after 2015. The current usage metrics is available 48-96 hours after online publication and is updated daily on week days.
Initial download of the metrics may take a while.