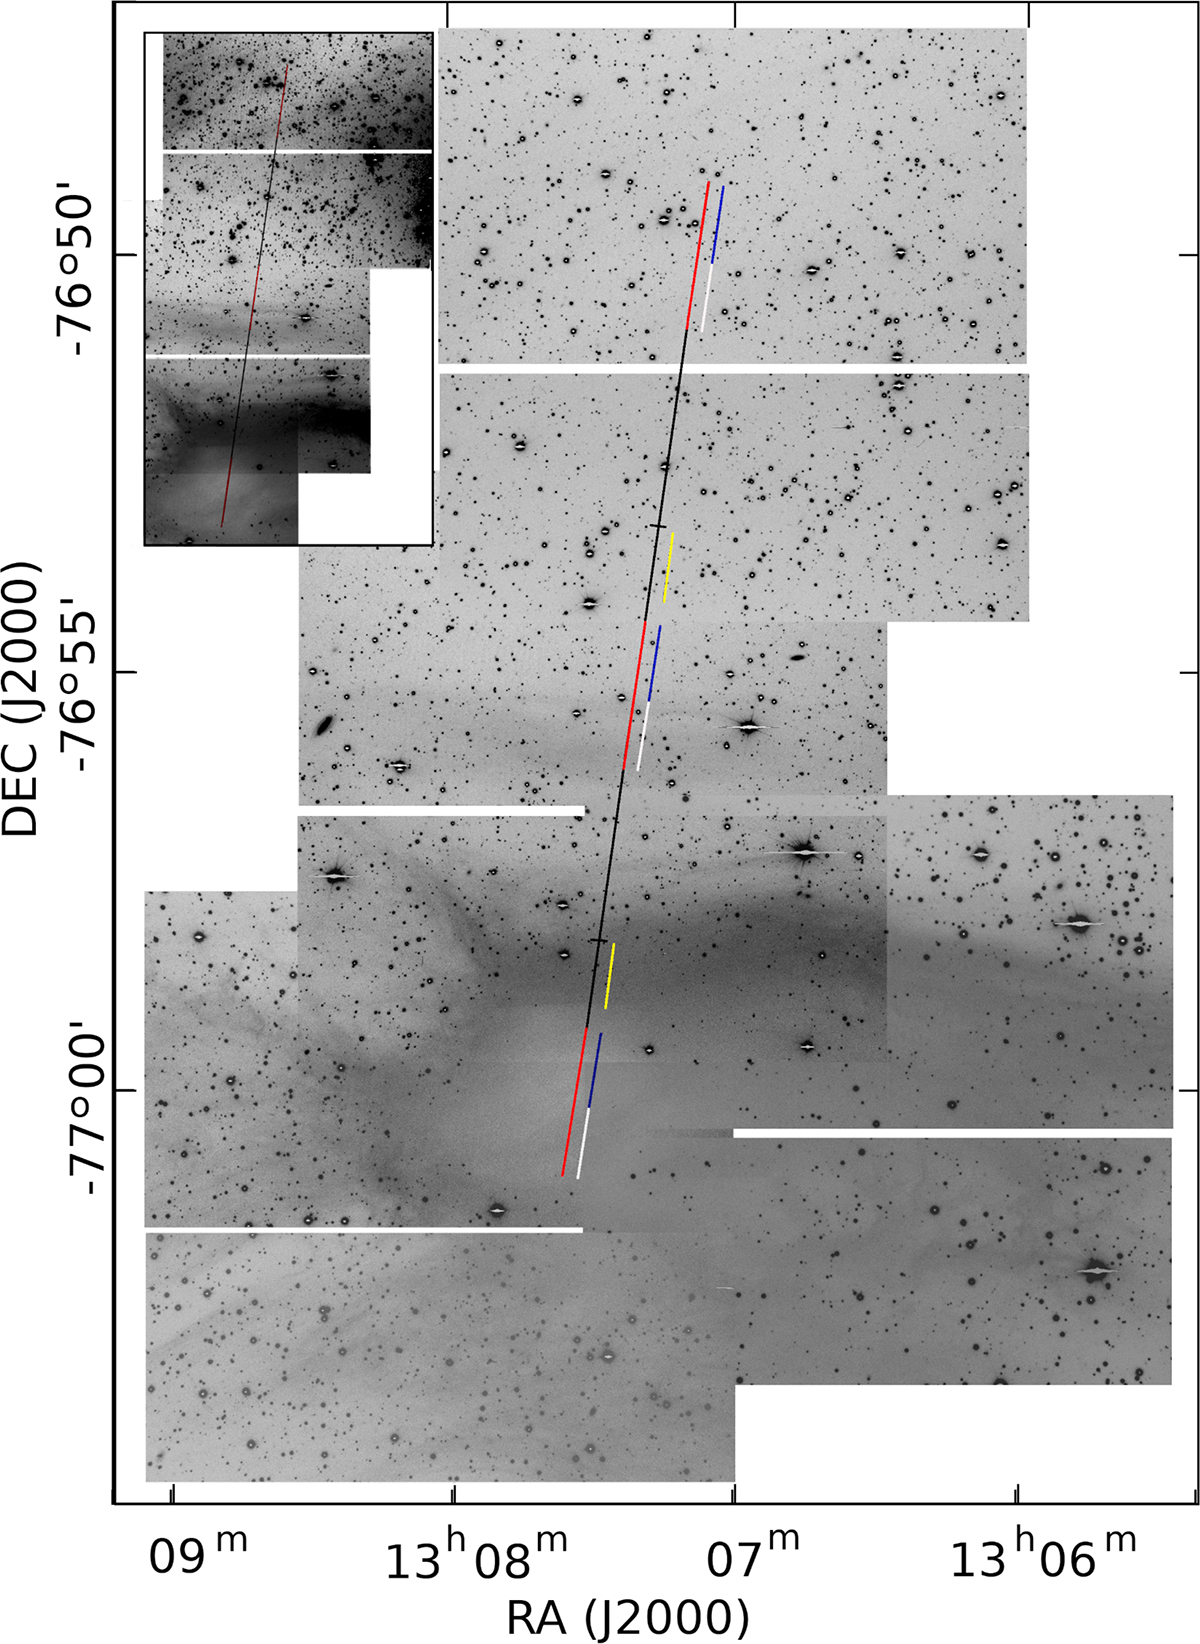
Fig. 2.
Download original image
Mosaic of the I–BESS images observed during the DC303.8 pre-imaging. The position of the two overlapping FORS longslit positions on the sky during the nodding are superposed on the image. The overlapping 100″ sections are indicated in red. The southernmost red section covering the globule core marks the position of the southern 100″ of the FORS2 CHIP2 during the first nod integration. The northernmost red section marks the northern 100″ part of CHIP1 during the second nod integration. The centermost red section is covered first by CHIP1 during the first nod integration and by the CHIP2 100″ section during the second nod integration. The slit sections discussed in the text are indicated in white, blue, and yellow.
Current usage metrics show cumulative count of Article Views (full-text article views including HTML views, PDF and ePub downloads, according to the available data) and Abstracts Views on Vision4Press platform.
Data correspond to usage on the plateform after 2015. The current usage metrics is available 48-96 hours after online publication and is updated daily on week days.
Initial download of the metrics may take a while.