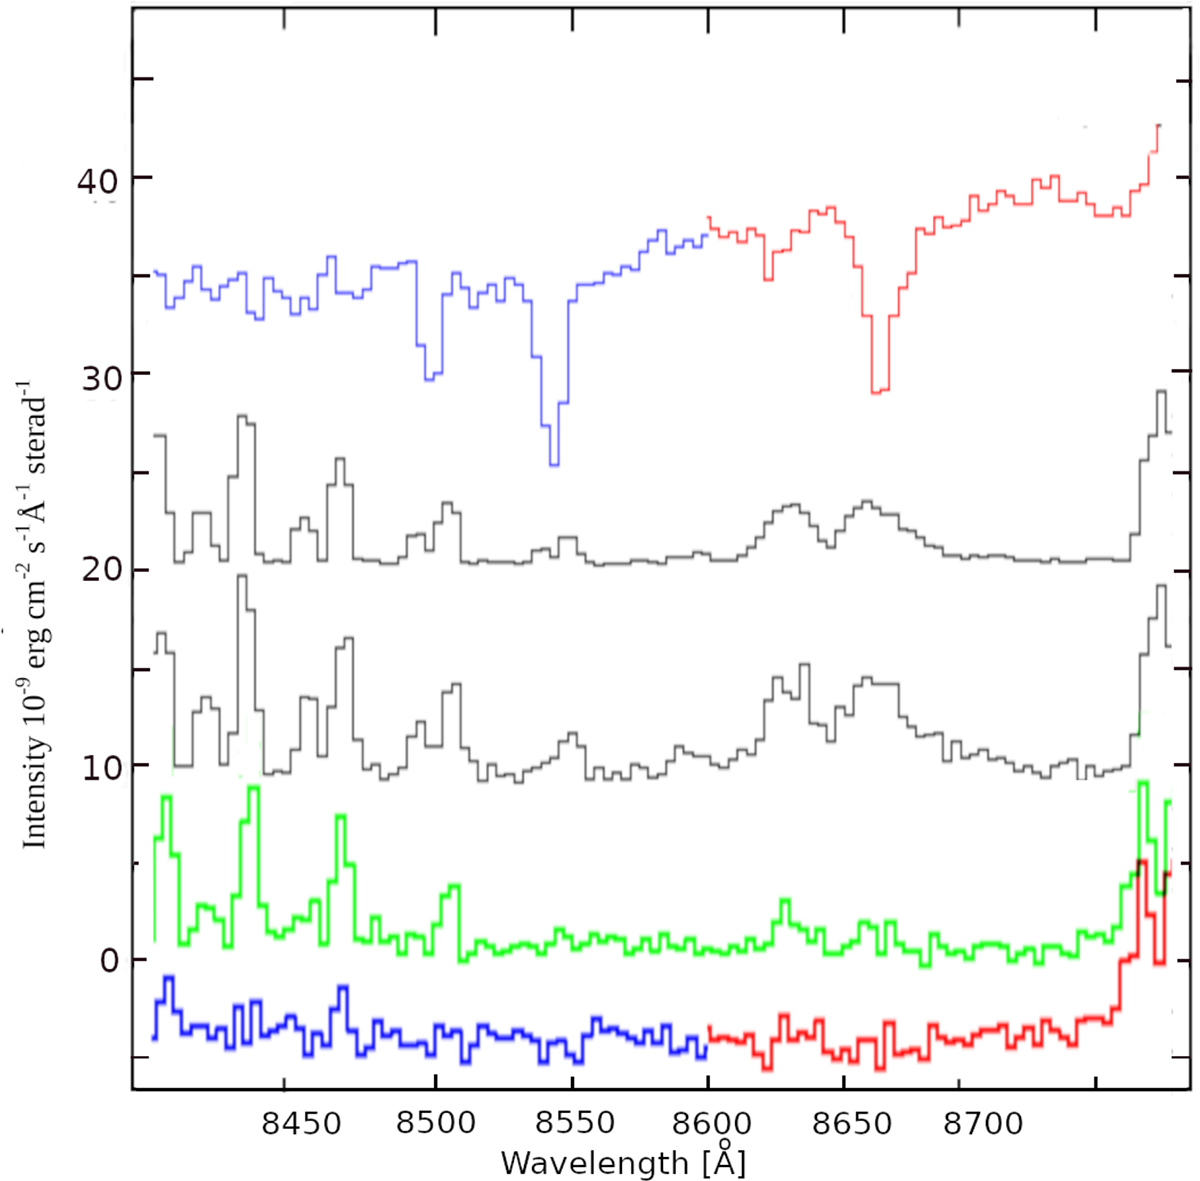
Fig. 3.
Download original image
From top to bottom: Chip 2 extracted Bright_rim spectrum combined from 179 on–off spectra below 8600 Å (in blue) and 228 on–off spectra above 8600 Å (in red). A typical airglow spectrum scaled by 1/500 and shifted upwards by 20 cgs-units. The standard deviation of the intensities along the slit in the Chip 2 Bright_rim 2D spectrum shifted upwards by 4 cgs-units. The A_100″-off spectrum (green) from the sum of all 270 off–on–off spectra; it has been shifted upwards by 3 cgs-units. The A_100″-off spectra for the sub-sets of 179 and 228 individual spectra, selected for minimum-AGL residuals in blue and red for λ < 8600 Å and λ > 8600 Å, respectively.
Current usage metrics show cumulative count of Article Views (full-text article views including HTML views, PDF and ePub downloads, according to the available data) and Abstracts Views on Vision4Press platform.
Data correspond to usage on the plateform after 2015. The current usage metrics is available 48-96 hours after online publication and is updated daily on week days.
Initial download of the metrics may take a while.