Fig. 2
Download original image
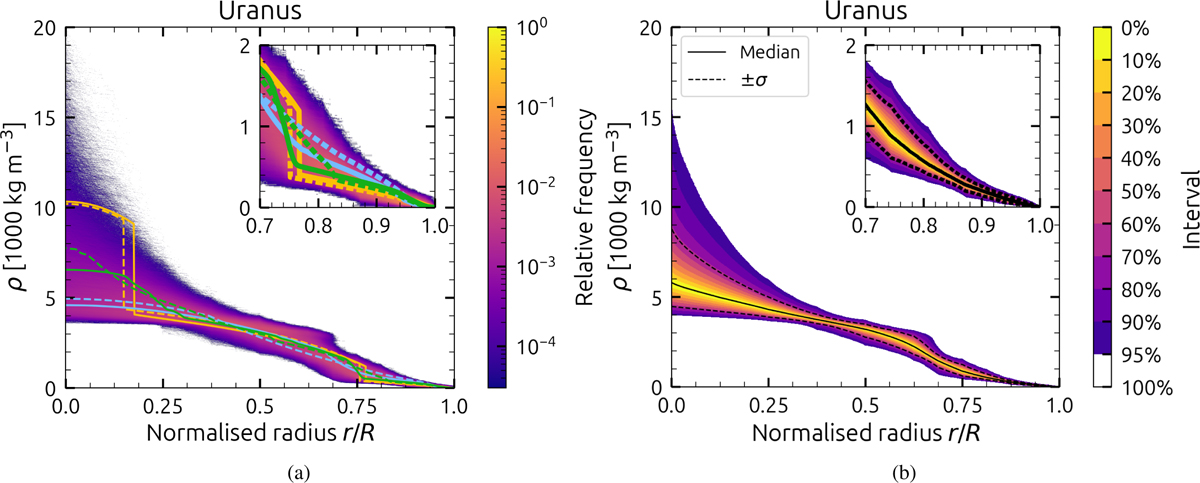
Solution space distribution (a) and contour of the distribution (b) for Uranus. The left panel a shows the weighted distribution of all successful uncorrelated Uranus density profiles. The inset shows a zoomed-in view of the outermost region, from r/R=1 to r/R=0.7. Note that the zoom is not aspect-preserving. The colour scale shows the relative frequency over all distributions of a certain density value at a given radius. Coloured lines show density profiles from previous studies for comparison. Solid and dashed lines correspond to models U1 and U2 from Nettelmann et al. (2013) (orange); U1 and U3 from Morf & Helled (2025) (green); and V2 and V3 from Vazan & Helled (2020) (blue), respectively. The colour scale in the right panel b shows the percentile intervals in 10% increments, except the last interval, where a 95% interval was added. The black line shows the median. The dashed lines show the 16th (lower) and 84th (upper) percentiles.
Current usage metrics show cumulative count of Article Views (full-text article views including HTML views, PDF and ePub downloads, according to the available data) and Abstracts Views on Vision4Press platform.
Data correspond to usage on the plateform after 2015. The current usage metrics is available 48-96 hours after online publication and is updated daily on week days.
Initial download of the metrics may take a while.