Open Access
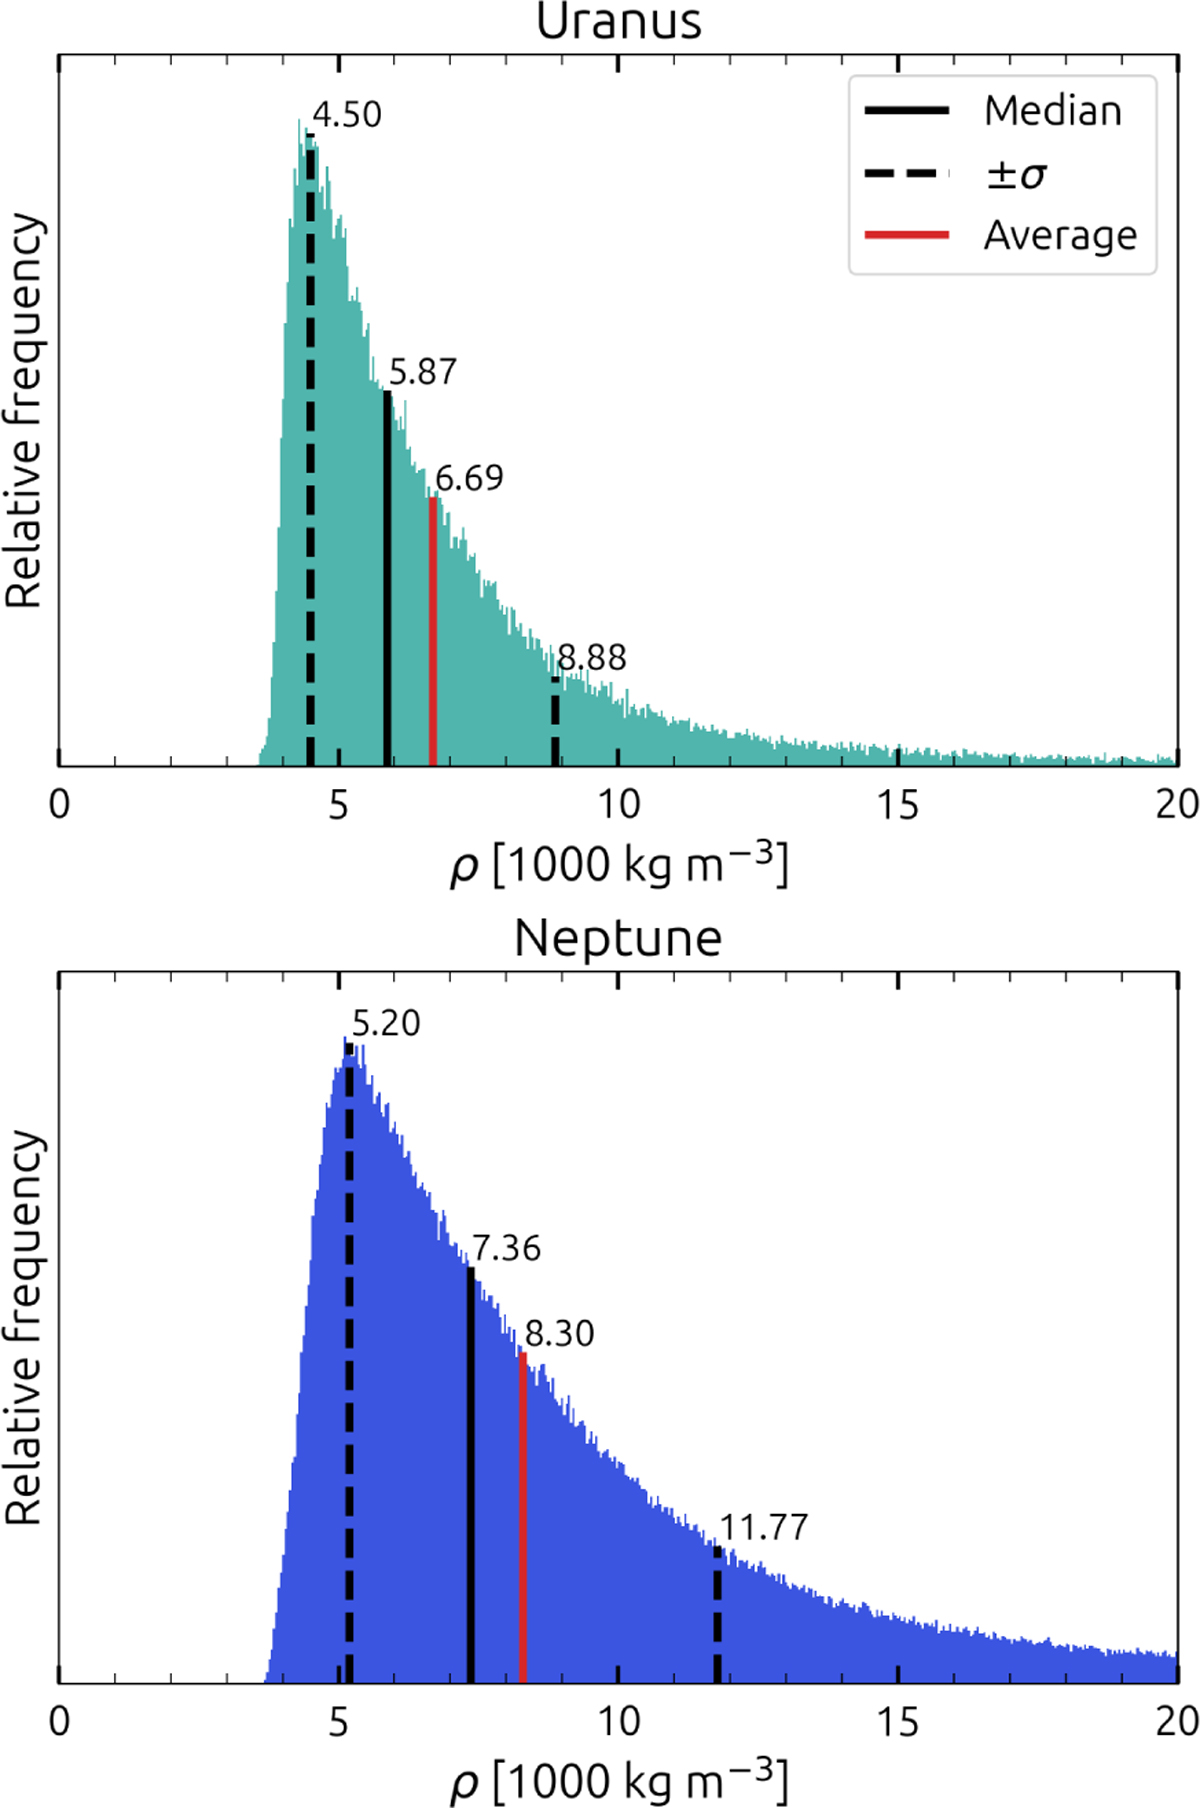
Fig. 4
Download original image
Central densities. The black lines are as before in Figures 2b and 3b. The red line denotes the average. This figure is equivalent to a side-on view of the density profile distributions (Figures 2a and 3a) at radius 0, except in linear scale. Note that the distribution is cut off at ρmax=20 000 kg m−3.
Current usage metrics show cumulative count of Article Views (full-text article views including HTML views, PDF and ePub downloads, according to the available data) and Abstracts Views on Vision4Press platform.
Data correspond to usage on the plateform after 2015. The current usage metrics is available 48-96 hours after online publication and is updated daily on week days.
Initial download of the metrics may take a while.