Fig. 6
Download original image
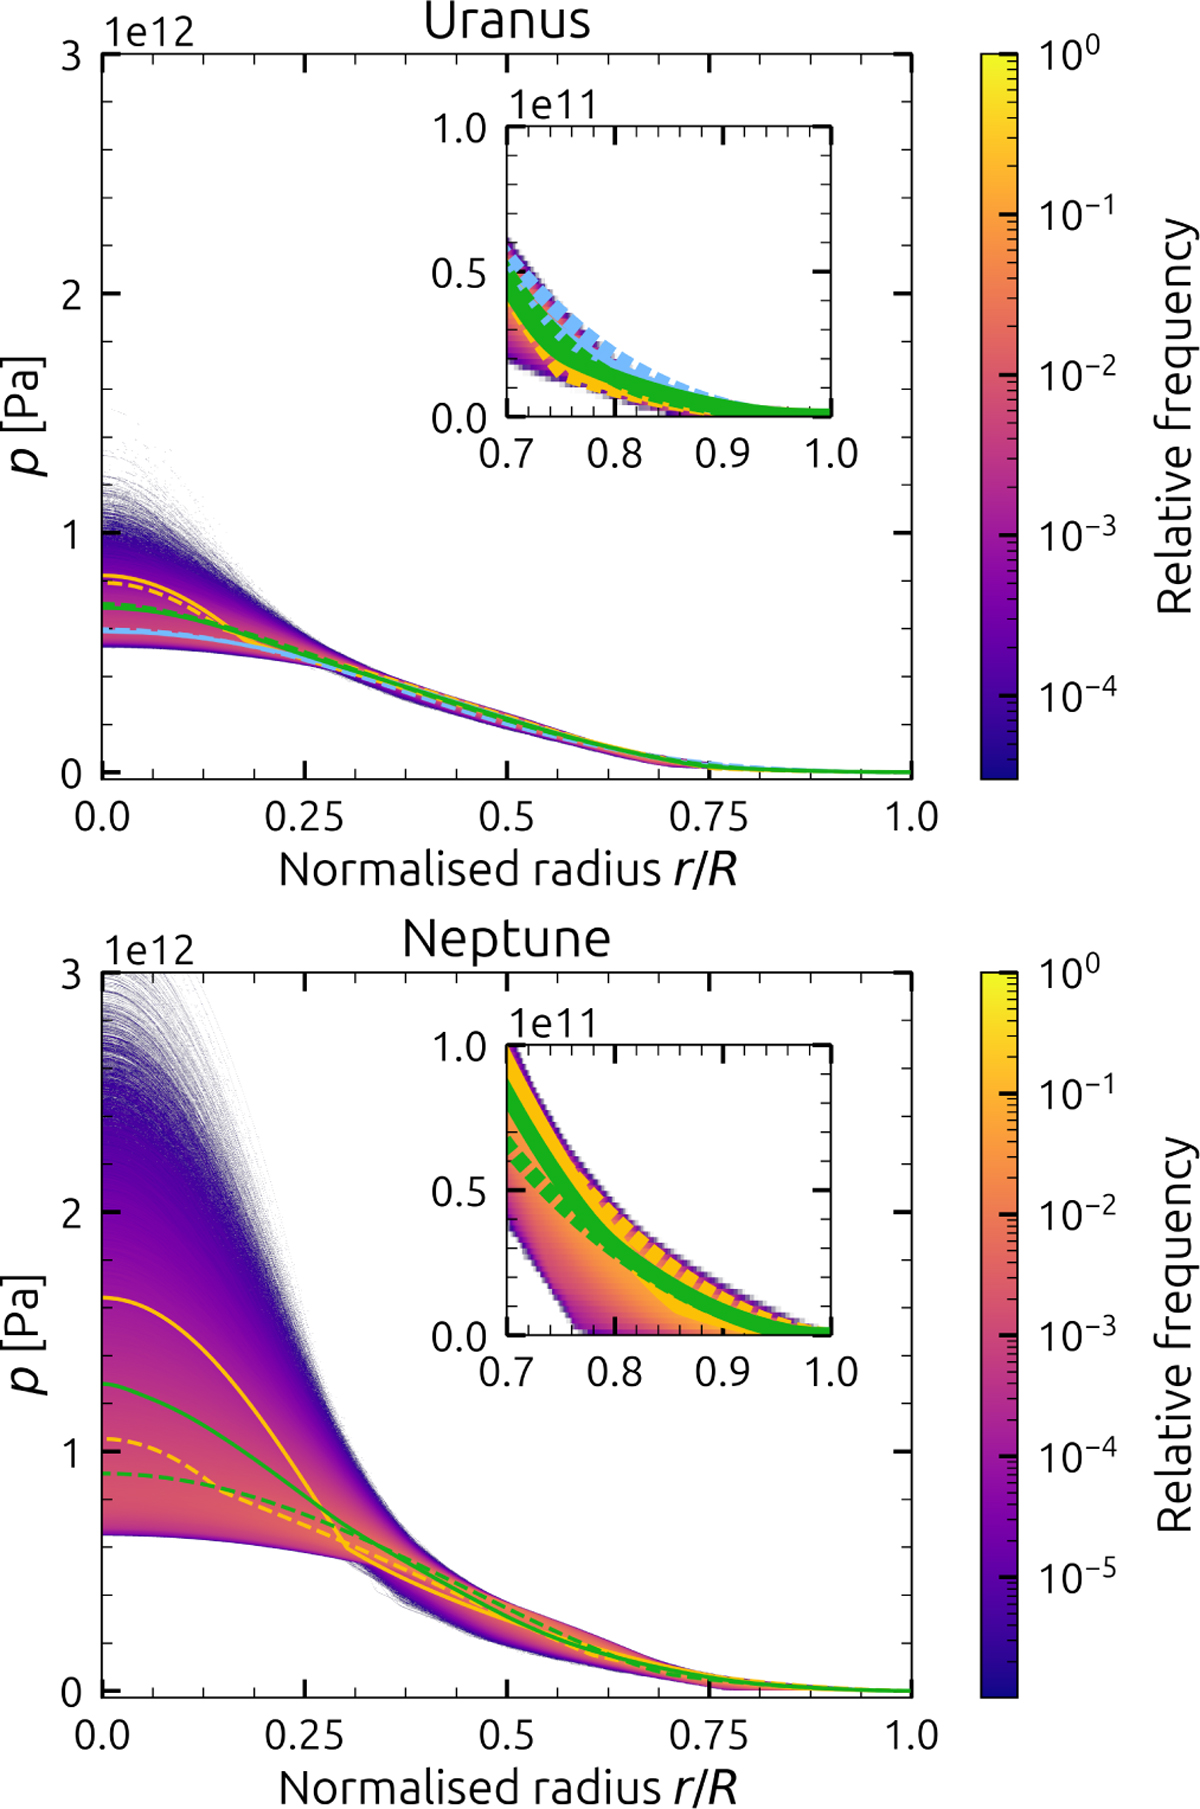
Pressure profiles. Weighted distribution of pressure profiles derived from all successful density profiles. The inset shows a zoomedin view of the outermost region, from r/R=1 to r/R=0.7. Note that the zoom is not aspect-preserving. The colour scale shows the relative frequency over all distributions of a certain pressure value at a given radius. The coloured lines are as before in Figures 2a and 3a.
Current usage metrics show cumulative count of Article Views (full-text article views including HTML views, PDF and ePub downloads, according to the available data) and Abstracts Views on Vision4Press platform.
Data correspond to usage on the plateform after 2015. The current usage metrics is available 48-96 hours after online publication and is updated daily on week days.
Initial download of the metrics may take a while.