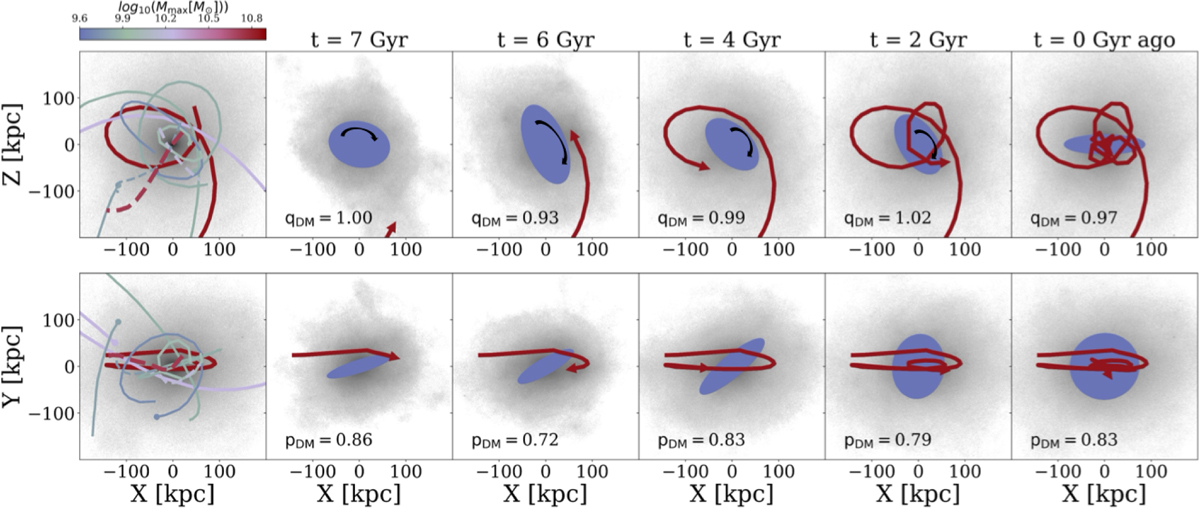
Fig. 11
Download original image
Spiral-in minor merger flips the stellar disc illustrated by TNG50 501208. The left column show orbits of the ten most massive mergers coloured their maximum history mass. The dashed red curve with Mmax = 5.3 × 10¹⁰ M⊙ is a major merger finished at about 8.5 Gyr ago, and the solid red curve with Mmax = 7.1 × 10¹⁰ M⊙ is the most massive minor merger followed. The rest columns show the DM distribution (the grey shadow), the projection of the stellar disc (the blue ellipse with size enlarged five times for visualisation), and the orbit progress of the most massive minor merger (solid red curve) at different snapshots in the history. The axis ratios of the DM halo measured at r = 50 kpc are labeled. A thin stellar disc was formed right after the major merger finished at about 8.5 Gyr ago. At about t = 6-7 Gyr ago the disc was aligned almost co-planar with the long-intermediate axis plane of the DM halo and orbital plane of the satellites. The disc was flipped in the last seven gigayears, associated with the spiral-in minor merger (solid red curve), while the general shape of DM halo (illustrated by qDM and pDM measured at 50 kpc in a fixed co-ordinate) and satellite arrangement remain unchanged, resulting in the stellar disc vertical to the DM halo and satellite orbit plane at present (also see Movie S1).
Current usage metrics show cumulative count of Article Views (full-text article views including HTML views, PDF and ePub downloads, according to the available data) and Abstracts Views on Vision4Press platform.
Data correspond to usage on the plateform after 2015. The current usage metrics is available 48-96 hours after online publication and is updated daily on week days.
Initial download of the metrics may take a while.