Fig. 12
Download original image
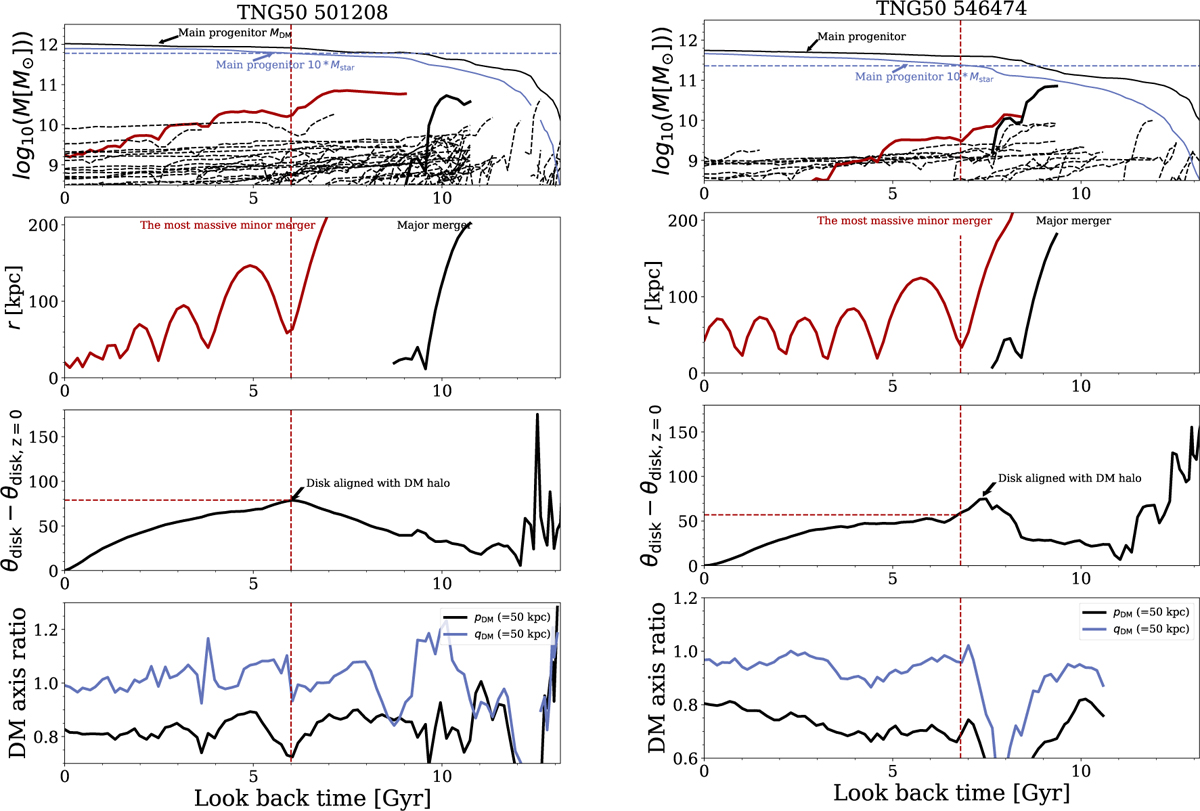
Evolution history of TNG50 501208 (left) and TNG50 546474 (right). We describe the four panels with TNG50 501208. Top : assembly history of the galaxy. The solid thick curves represent two of the most massive mergers the galaxy experienced. The dashed curves represent small mergers. TNG50 501208 has assembled 80% of its DM mass and 72% of its stellar mass at t = 6 Gyr ago. Second row : distance of the satellite to the galacetic center as a function of time. The solid black curve is a major merger ended at t ~ 8.5 Gyr ago. The red curve is the following most massive minor merger with Mmax = 7.1 × 10¹⁰ M⊙. The vertical dashed red line indicates the time at which it reached the pericenter for the first time. Third row : variation in the disc spin direction as a function of time. The disc was co-aligned with the long-intermediate axis plane of the DM halo at t ~ 6 Gyr ago, and it has tilted 80° in the past 6 Gyr. Bottom: evolution of the DM axis ratios, with pDM = Y/X and qDM = Z/X. The DM shape remain largely unchanged in the past 8 Gyr. The four panels in the right show a similar evolution history of TNG50 546474.
Current usage metrics show cumulative count of Article Views (full-text article views including HTML views, PDF and ePub downloads, according to the available data) and Abstracts Views on Vision4Press platform.
Data correspond to usage on the plateform after 2015. The current usage metrics is available 48-96 hours after online publication and is updated daily on week days.
Initial download of the metrics may take a while.