Fig. 6
Download original image
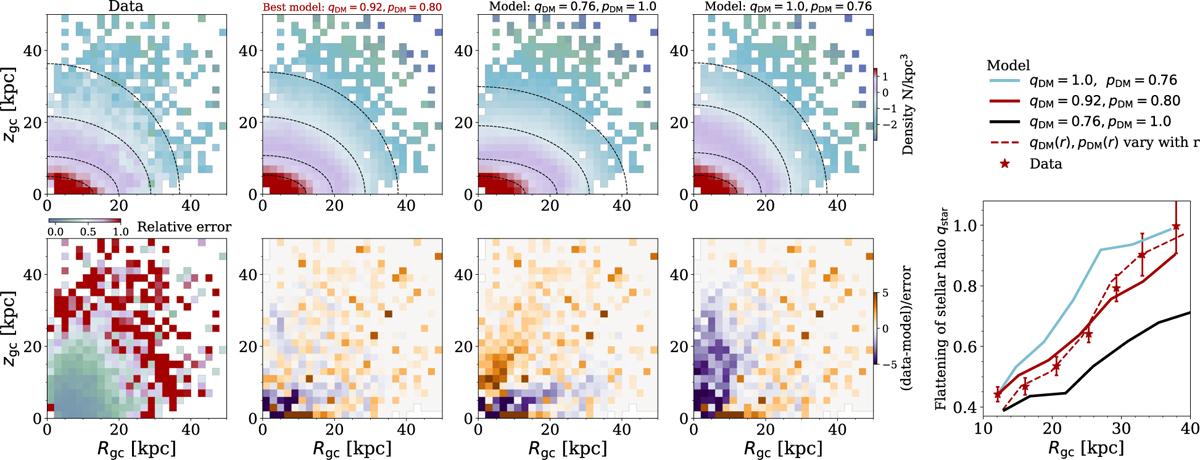
Comparison of the observational data and the empirical orbit superposed model: the stellar density distribution. The top panels from left to right are the 2D density distribution ρstar in Rgc versus zgc constructed by data, our best-fitting model (qDM = 0.92, pDM = 0.80), a model with a flatter DM halo, and a model with a rounder DM halo. The bottom panels show the relative error of the data, and the corresponding model residuals. The inset panel in the right shows the flattening of the stellar halo, qstar ≡ zgc/Rgc, as a function of the radius, Rgc, extracted from the iso-density contours of the 2D density distribution. The star symbols with the error bar are data. The solid red, light blue, and black curves indicate the three models shown on the left. The dashed red curve indicates a model allowing qDM and pDM to vary as a function of radius. The best-fitting model constructed stellar density distribution that matches the observational data well, while models with flatter or rounder DM halos constructed stellar halos that are either too flat or too round. The density distribution of the halo stars, especially the flattening qstar, has strong constraints on the shape of the underlying DM halo.
Current usage metrics show cumulative count of Article Views (full-text article views including HTML views, PDF and ePub downloads, according to the available data) and Abstracts Views on Vision4Press platform.
Data correspond to usage on the plateform after 2015. The current usage metrics is available 48-96 hours after online publication and is updated daily on week days.
Initial download of the metrics may take a while.