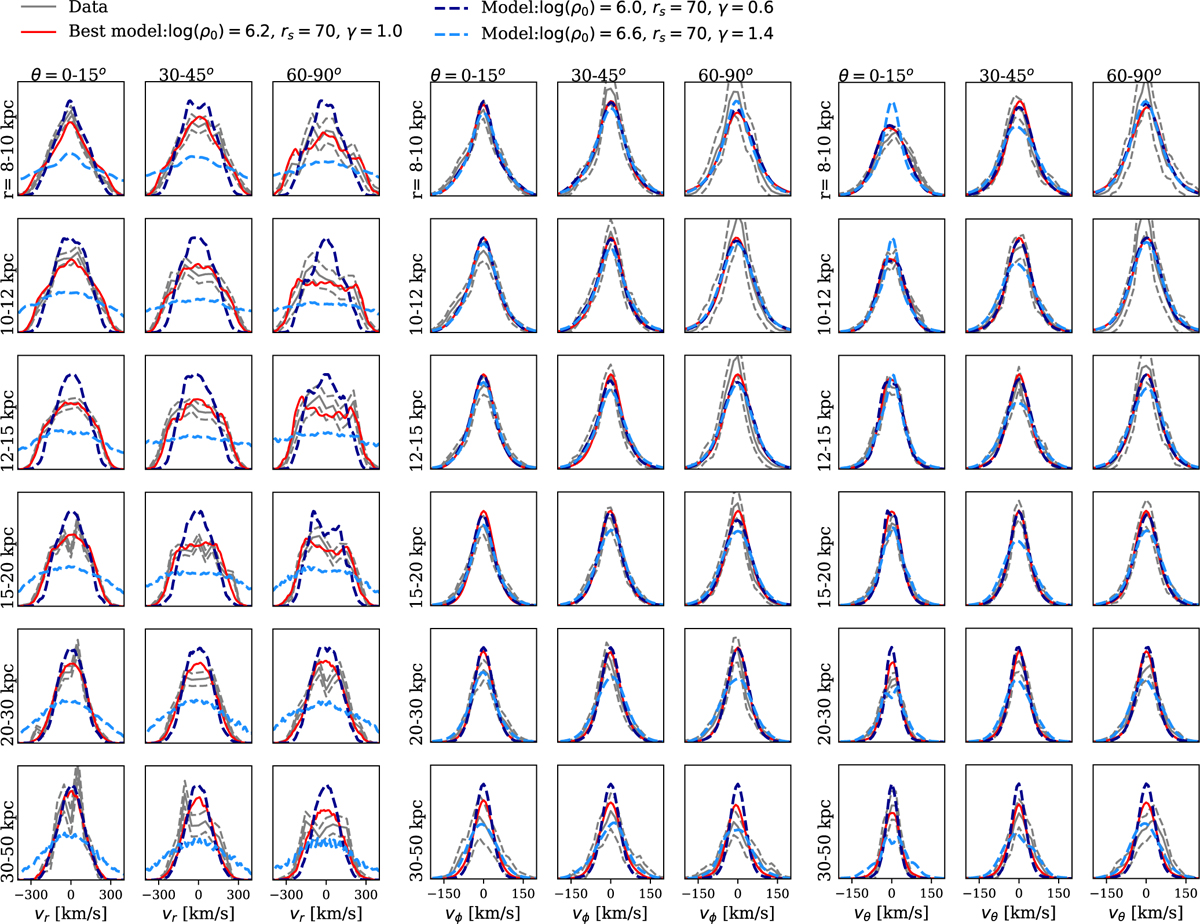
Fig. 7
Download original image
Comparison of the observational data and the empirical orbit superposed model: the 3D velocity distributions vr, vφ, and vθ in different spatial bins. We divided the system into 7 × 5 bins in r versus θ, but eliminating the first row with r < 8 kpc and only showing the odd number of columns here. In each sub-panel, the solid and dashed grey curves are the mean and 1σ uncertainty of the distribution constructed from observational data. The red, dark blue, and light blue curves were constructed by models with different radial distributions of the underlying DM mass. The model with a DM mass of log(ρ0[M⊙/kpc3]) = 6.2, rs = 70 kpc, and γ = 1.0 (red) matches the data well. The velocity distribution of stars, especially vr, strongly constrains the radial distribution of the underlying DM distributions.
Current usage metrics show cumulative count of Article Views (full-text article views including HTML views, PDF and ePub downloads, according to the available data) and Abstracts Views on Vision4Press platform.
Data correspond to usage on the plateform after 2015. The current usage metrics is available 48-96 hours after online publication and is updated daily on week days.
Initial download of the metrics may take a while.