Fig. 8
Download original image
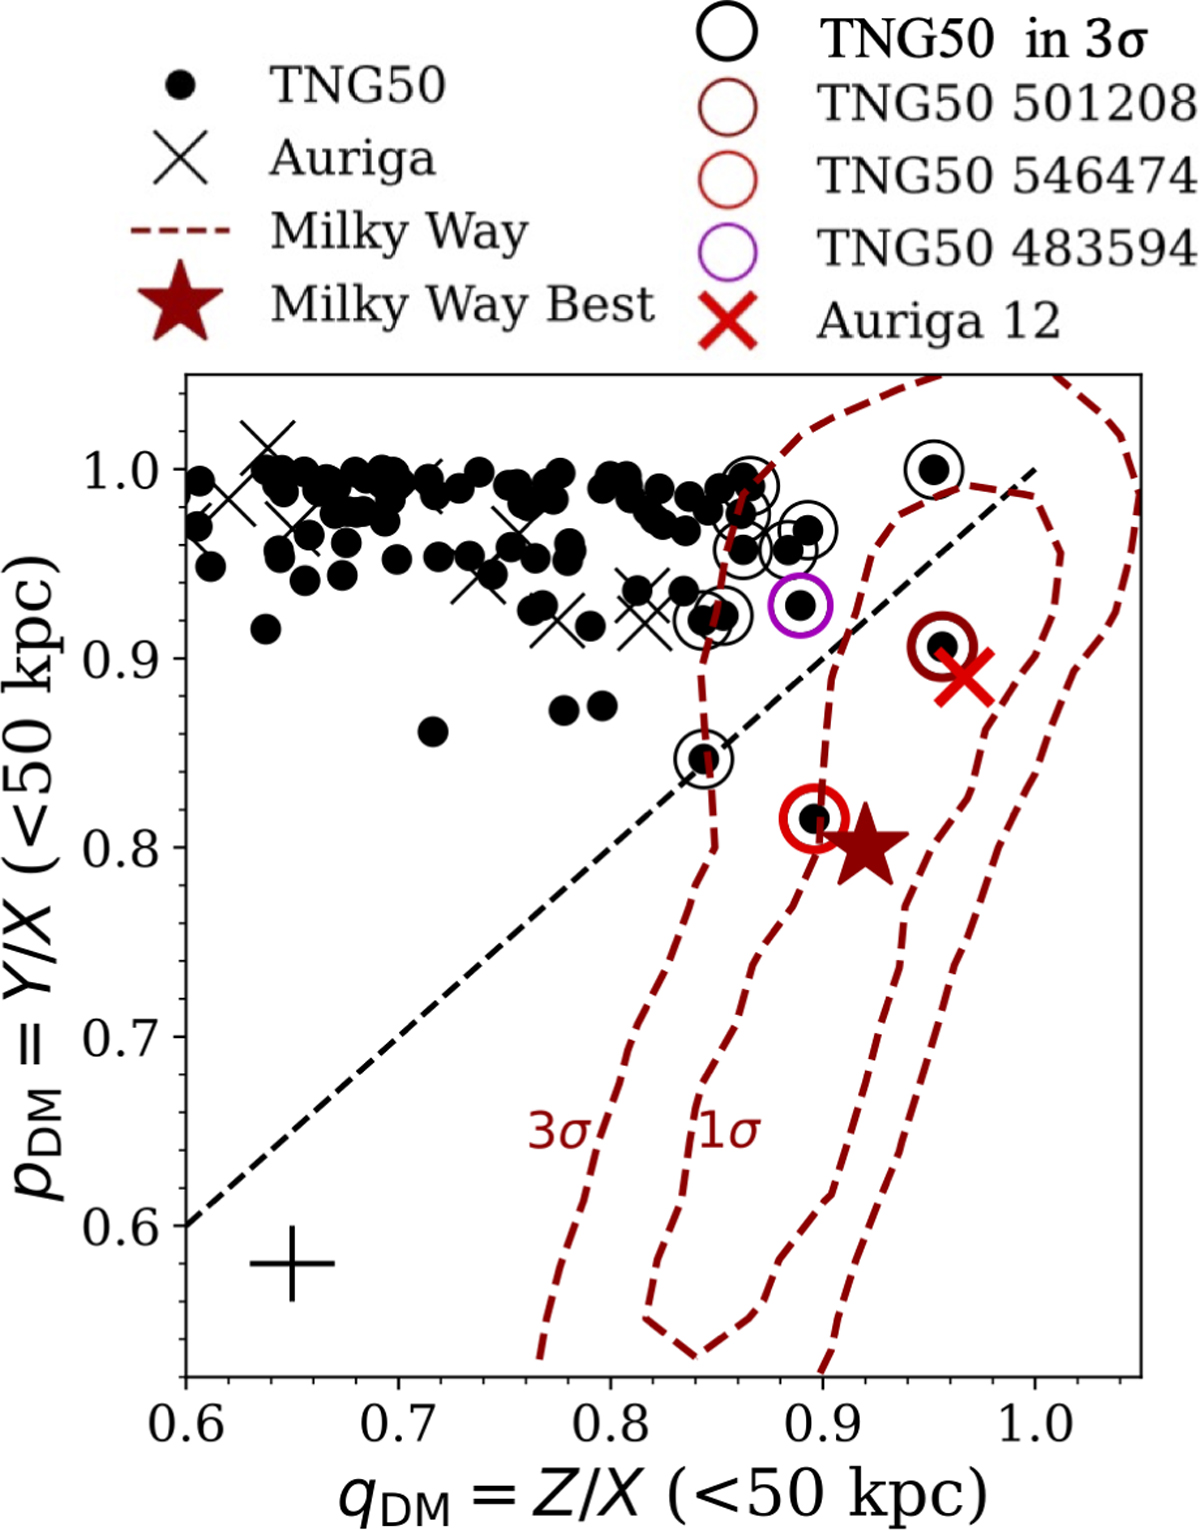
DM halo shape, qDM = Z/X versus pDM = Y/X, of the Milky Way in comparison with TNG50 and Auriga galaxies. The dashed red contours indicate the 1σ and 3σ confidence level of the Milky Way DM axis ratios obtained by our models. The red star marks the best-fitting model with qDM = 0.92 and pDM = 0.8. Each black dot is a Milky Way-like galaxy from TNG50 simulations. Each black multiple is a galaxy from Auriga simulations. The plus at the bottom left indicates the typical uncertainty of DM halo shapes measured for TNG50/Auriga galaxies. The four simulations highlighted by red/magenta circles/multiple are those associated with a vertical satellite plane. As we show later, those highlighted by black circles are all simulations lying within a 3σ range of the Milky Way but without significant vertical satellite planes.
Current usage metrics show cumulative count of Article Views (full-text article views including HTML views, PDF and ePub downloads, according to the available data) and Abstracts Views on Vision4Press platform.
Data correspond to usage on the plateform after 2015. The current usage metrics is available 48-96 hours after online publication and is updated daily on week days.
Initial download of the metrics may take a while.