Fig. 1.
Download original image
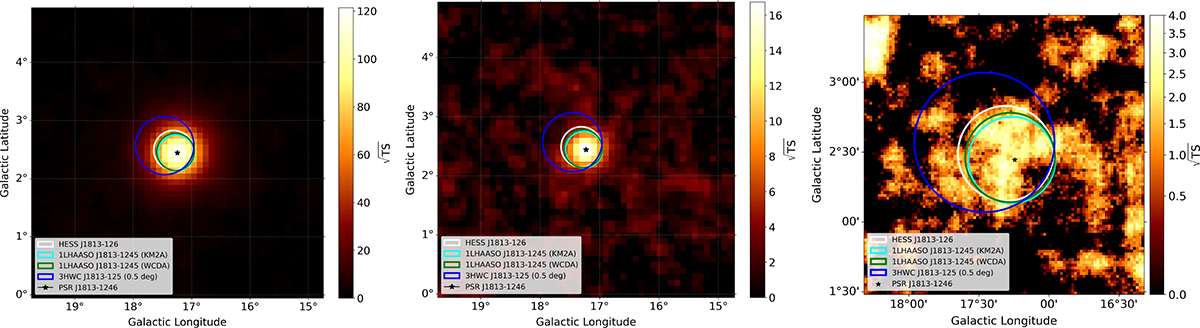
Significance maps of the HESS J1813-126 region. Left: Significance map of 4FGL J1813.4-1246 from the phase-averaged analysis. Middle: Same but for PS J1813.3-1246, detected during the off-pulse phase of the 4FGL source. Right: H.E.S.S. significance map. The color bar in each plot provides the significance level. The source extent for H.E.S.S., HAWC, and LHAASO (KM2A and WCDA) is shown as colored circles.
Current usage metrics show cumulative count of Article Views (full-text article views including HTML views, PDF and ePub downloads, according to the available data) and Abstracts Views on Vision4Press platform.
Data correspond to usage on the plateform after 2015. The current usage metrics is available 48-96 hours after online publication and is updated daily on week days.
Initial download of the metrics may take a while.