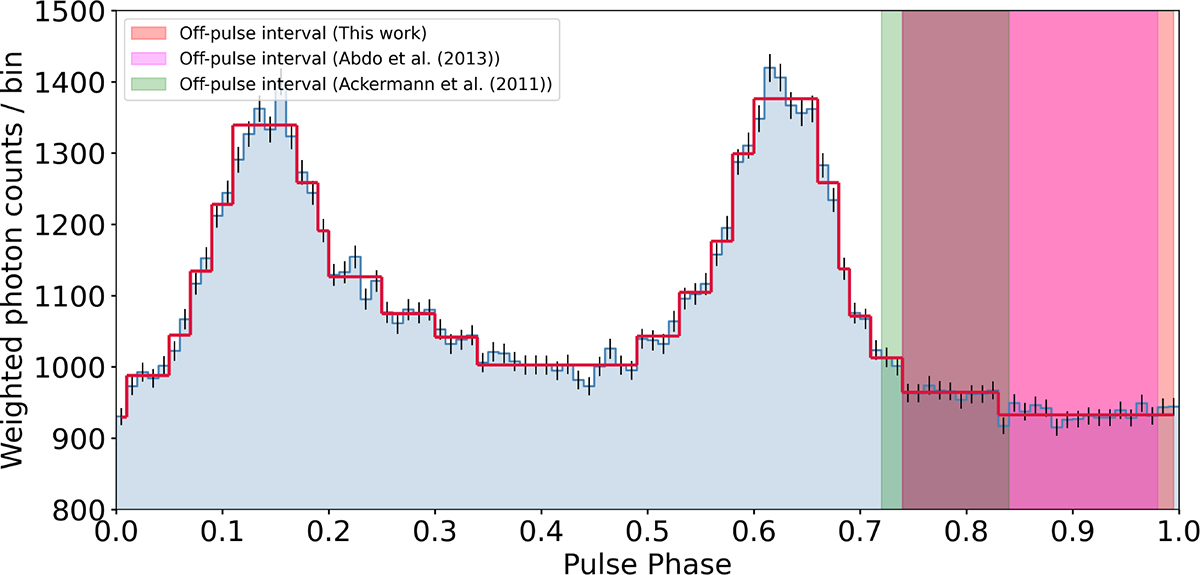
Fig. 2.
Download original image
Weighted pulse profile of PSR J1813-1246 (4FGL J1813.4-1246) over one rotational cycle (pulse phase 0-1). It was constructed using 100 uniform phase bins per period from events between 0.1 and 500 GeV with the model weight from Bruel (2019). The blue histogram shows the weighted photon counts per phase bin, while the solid red line indicates the Bayesian block decomposition of statistically significant structures in the weighted pulse profile. The red shaded region signifies the off-pulse interval estimated from this work, whereas the magenta and green shaded regions signify the same obtained in Abdo et al. (2013) and Ackermann et al. (2011), respectively.
Current usage metrics show cumulative count of Article Views (full-text article views including HTML views, PDF and ePub downloads, according to the available data) and Abstracts Views on Vision4Press platform.
Data correspond to usage on the plateform after 2015. The current usage metrics is available 48-96 hours after online publication and is updated daily on week days.
Initial download of the metrics may take a while.