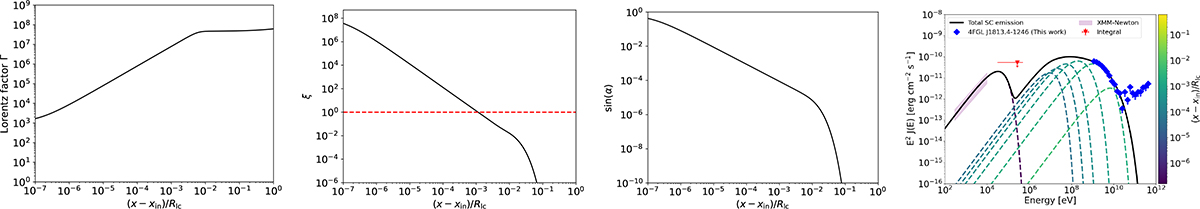
Fig. 3.
Download original image
Distance variation of different SC model parameters and the spectrum of PSR J1813-1246: Lorentz factor (Γ; first panel), SC parameter (ξ; second panel), and pitch angle (sin α; third panel). In the second panel, the dashed red line marks ξ = 1, i.e., the transition point between synchrotron- and curvature-dominated regimes. In the last panel, the model spectrum is plotted against the observed SED obtained from the Fermi-LAT data analysis of 4FGL J1813.4-1246 and the X-ray SED and upper limit from XMM-Newton and INTEGRAL data, respectively, as obtained from Marelli et al. (2014) and Guevel et al. (2025). In the last panel, decomposed emission from different parts of the emitting region is also shown; the colorbar signifies the distance from the inner boundary (xin) in units of the light-cylinder radius (Rlc).
Current usage metrics show cumulative count of Article Views (full-text article views including HTML views, PDF and ePub downloads, according to the available data) and Abstracts Views on Vision4Press platform.
Data correspond to usage on the plateform after 2015. The current usage metrics is available 48-96 hours after online publication and is updated daily on week days.
Initial download of the metrics may take a while.