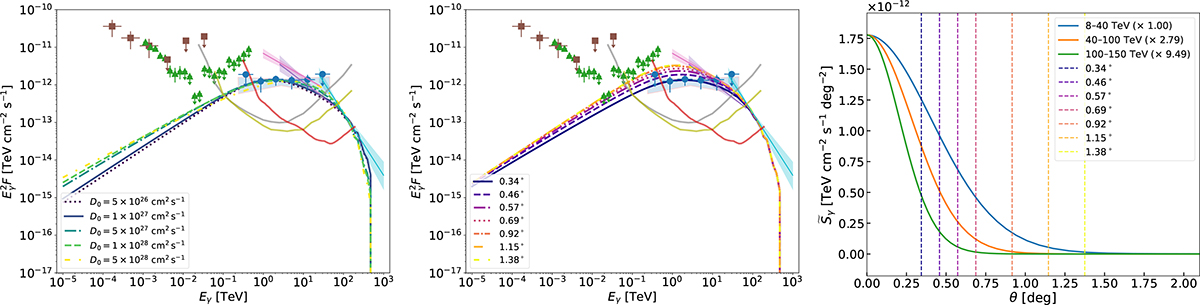
Fig. 4.
Download original image
Exploration of SEDs and SBPs of HESS J1813-126 in the 2ZISD framework. Left: SEDs corresponding to different choices of inner zone diffusion coefficients. The D0 in the plot signifies the normalization of the inner zone diffusion coefficient. Middle: Angle-integrated SEDs with increasing aperture sizes starting from 0.34°, assuming D0 = 5 × 1027 cm2 s−1. In these two panels, the brown squares and green triangles (along with the upper limits) correspond to the off-pulse emission from Ackermann et al. (2011) and this work (PS J1813.3-1246), respectively. The blue data points and butterfly plot correspond to the H.E.S.S. data, whereas the purple, pink, and sky blue butterfly plots correspond to the HAWC, LHAASO WCDA, and KM2A observations, respectively. We also provide the sensitivity curves for the CTA-North (gray), CTA-South (yellow-green), and SWGO (red) for comparison. Right: SBPs for three different energy ranges scaled to start from the same point. Vertical lines correspond to the aperture sizes and have the same color scheme as in the middle panel.
Current usage metrics show cumulative count of Article Views (full-text article views including HTML views, PDF and ePub downloads, according to the available data) and Abstracts Views on Vision4Press platform.
Data correspond to usage on the plateform after 2015. The current usage metrics is available 48-96 hours after online publication and is updated daily on week days.
Initial download of the metrics may take a while.