Fig. 7.
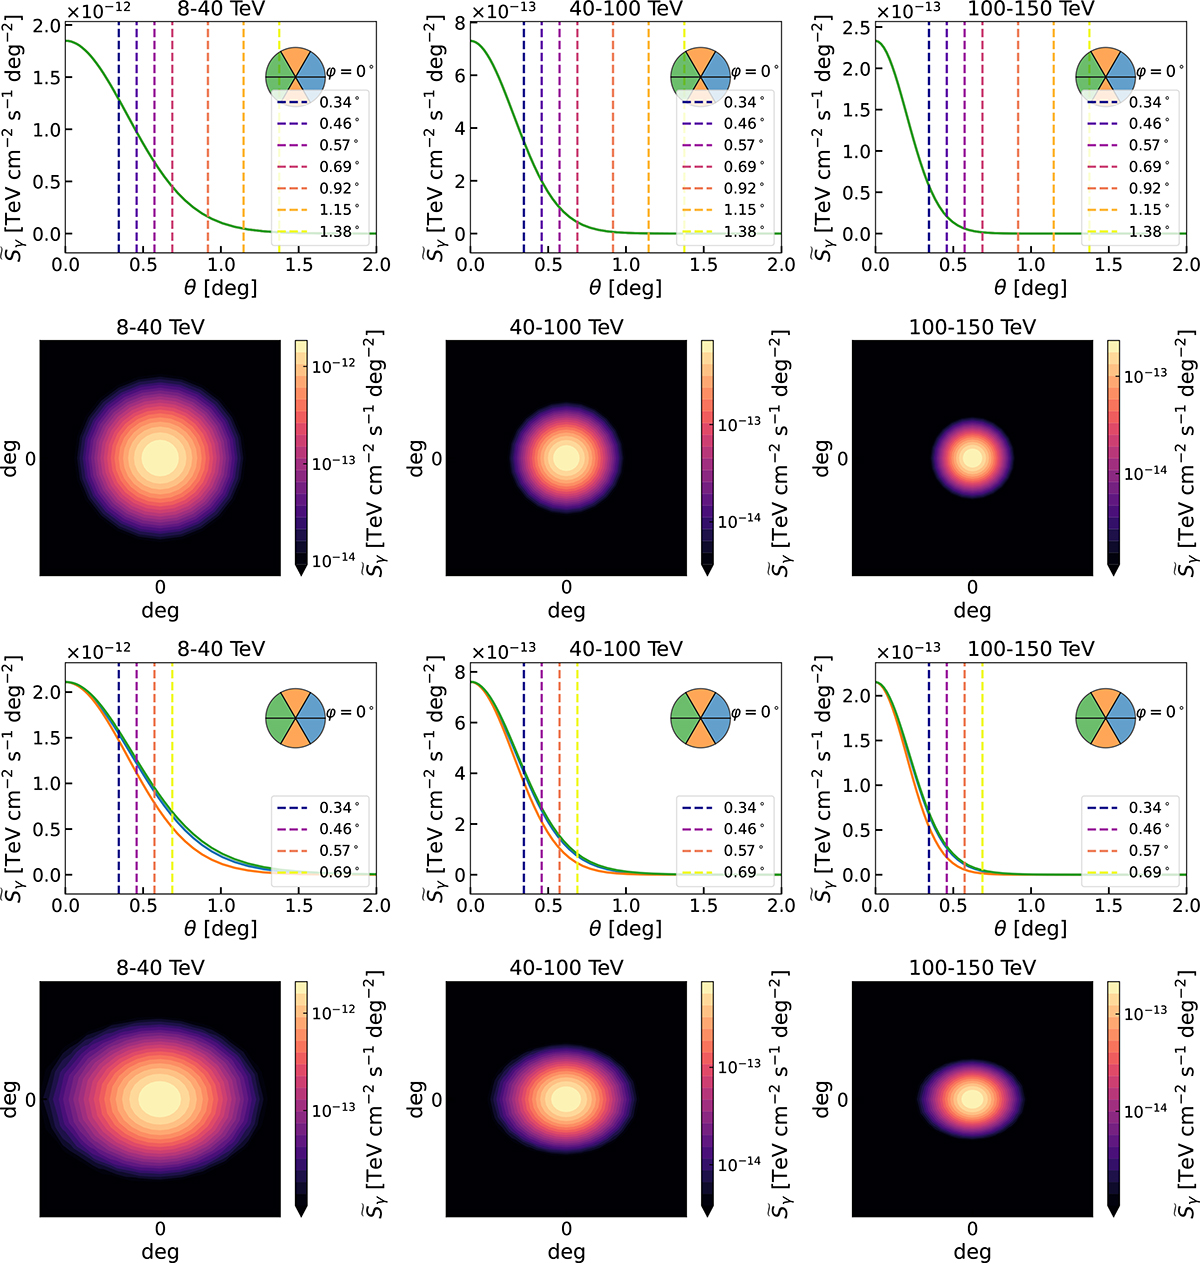
Download original image
Exploration of SBPs and gamma-ray maps of HESS J1813-126 in the AD framework. The model SBPs are shown for two combinations of MA and ζ and for three energy ranges, scaled to start from the same point, and along with vertical lines, corresponding to the same aperture sizes and with the same color scheme as in Fig. 6. The SBP curves are divided across different azimuthal intervals, visualized as circular pie charts in the corresponding plots. The figure also shows gamma-ray maps in three energy ranges for the two considered combinations, to emphasize the anisotropy of the AD model. Top two panels: Results for MA = 0.35 and ζ = 0°. Bottom two panels: Results for MA = 0.35 and ζ = 10°.
Current usage metrics show cumulative count of Article Views (full-text article views including HTML views, PDF and ePub downloads, according to the available data) and Abstracts Views on Vision4Press platform.
Data correspond to usage on the plateform after 2015. The current usage metrics is available 48-96 hours after online publication and is updated daily on week days.
Initial download of the metrics may take a while.