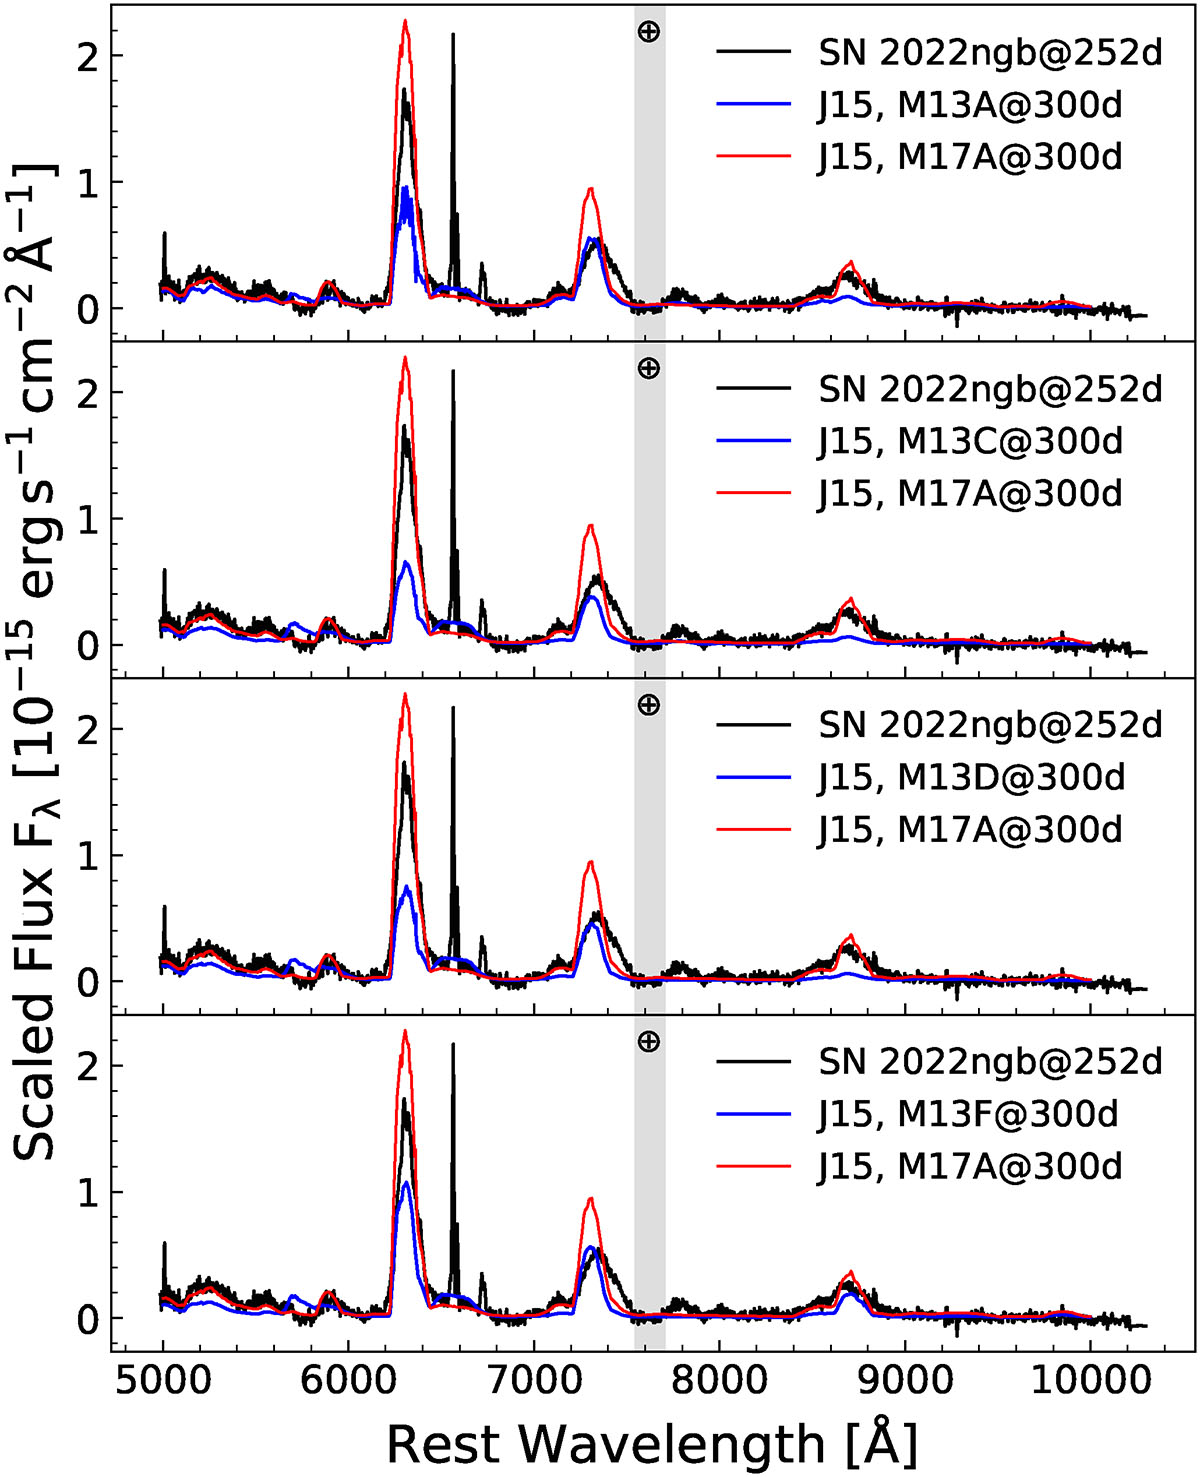
Fig. 13.
Download original image
Nebular phase spectrum of SN 2022ngb at +252 days post-explosion (black line), compared with synthetic spectra taken from the SN IIb models of Jerkstrand et al. (2015). The blue lines represent various models for a MZAMS = 13 M⊙ progenitor, while the red line shows a model for a 17 M⊙ progenitor. The narrow lines in the spectra are the emission lines from the H II region of the host galaxy.
Current usage metrics show cumulative count of Article Views (full-text article views including HTML views, PDF and ePub downloads, according to the available data) and Abstracts Views on Vision4Press platform.
Data correspond to usage on the plateform after 2015. The current usage metrics is available 48-96 hours after online publication and is updated daily on week days.
Initial download of the metrics may take a while.