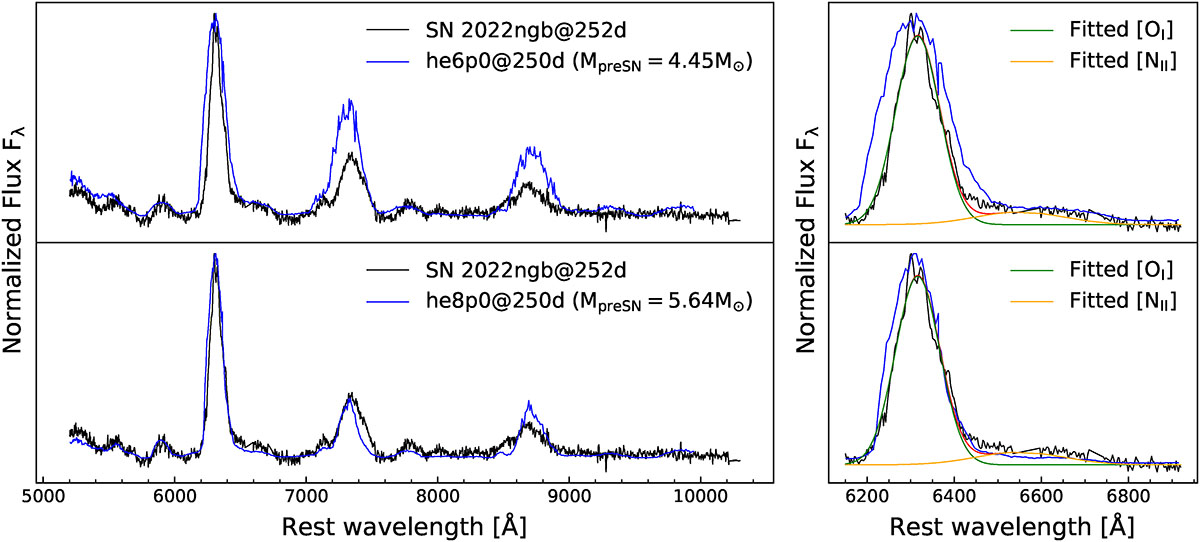
Fig. 14.
Download original image
Nebular phase spectrum of SN 2022ngb at +252 days from explosion (black line), compared with synthetic spectra from the He-star models of Barmentloo et al. (2024). All spectra are normalized to their maximum flux and have the continuum removed. Left panel: Comparison of the nebular spectrum of SN 2022ngb with He-star models of varying MpreSN. Right panel: A detailed comparison of the [O I] and [N II] line profiles. The green and orange solid lines represent Gaussian fits to the [O I] and [N II] components, respectively. The emission lines from the H II region of the host galaxy is removed for a better comparison.
Current usage metrics show cumulative count of Article Views (full-text article views including HTML views, PDF and ePub downloads, according to the available data) and Abstracts Views on Vision4Press platform.
Data correspond to usage on the plateform after 2015. The current usage metrics is available 48-96 hours after online publication and is updated daily on week days.
Initial download of the metrics may take a while.