Fig. 15.
Download original image
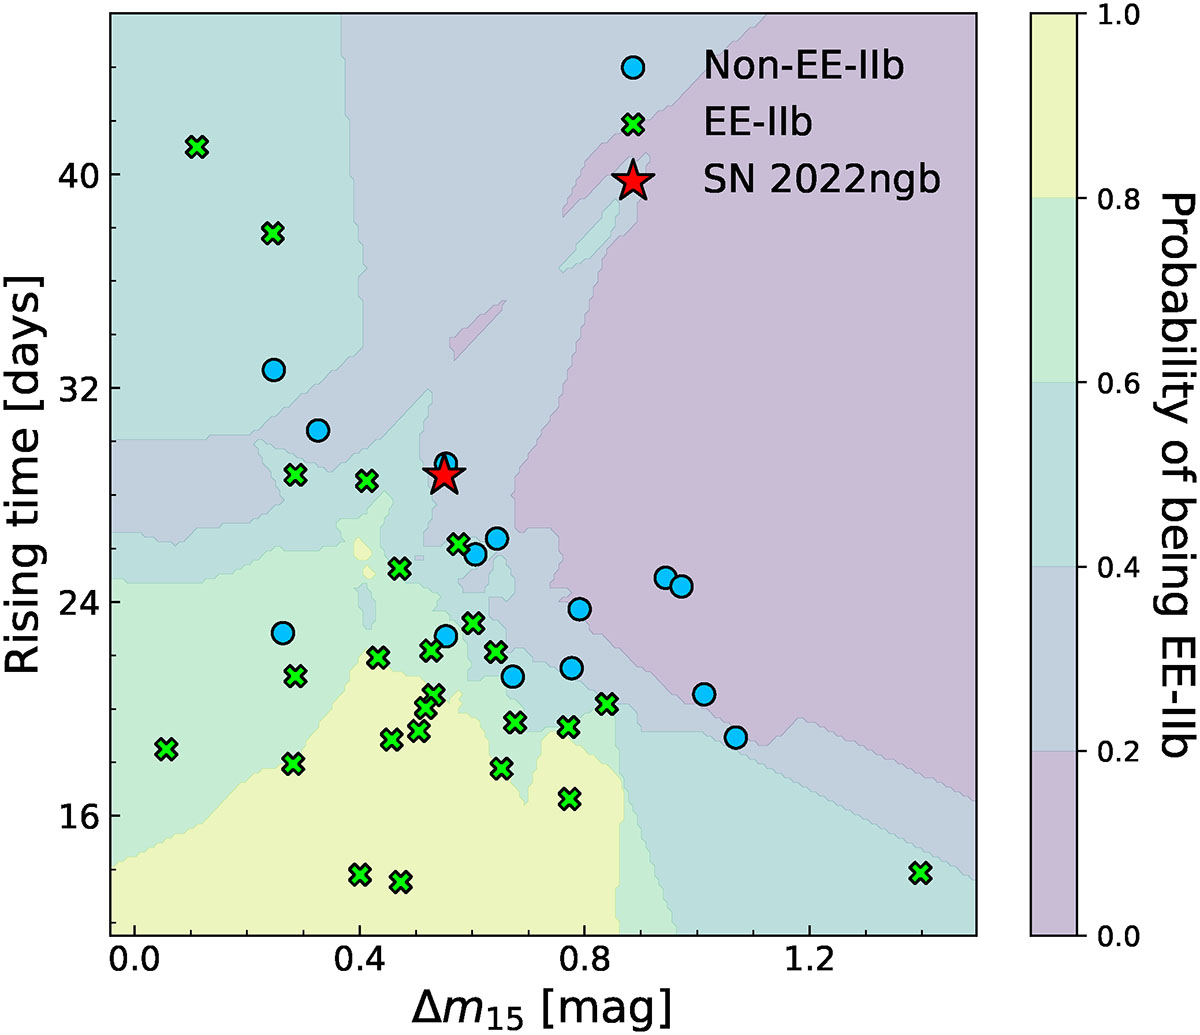
Magnitude decline rate vs. rise time in SNe IIb in the ATLAS o bands. The cyan points represent SNe IIb with no prominent early emission (Non-EE-IIb), and the green points stand for those with prominent early emission (EE-IIb). The red star indicates the position of SN 2022ngb in the diagram. The different colored regions in the plots represent the K-NN-derived probability that an event belongs to the EE-IIb class.
Current usage metrics show cumulative count of Article Views (full-text article views including HTML views, PDF and ePub downloads, according to the available data) and Abstracts Views on Vision4Press platform.
Data correspond to usage on the plateform after 2015. The current usage metrics is available 48-96 hours after online publication and is updated daily on week days.
Initial download of the metrics may take a while.