Fig. 17.
Download original image
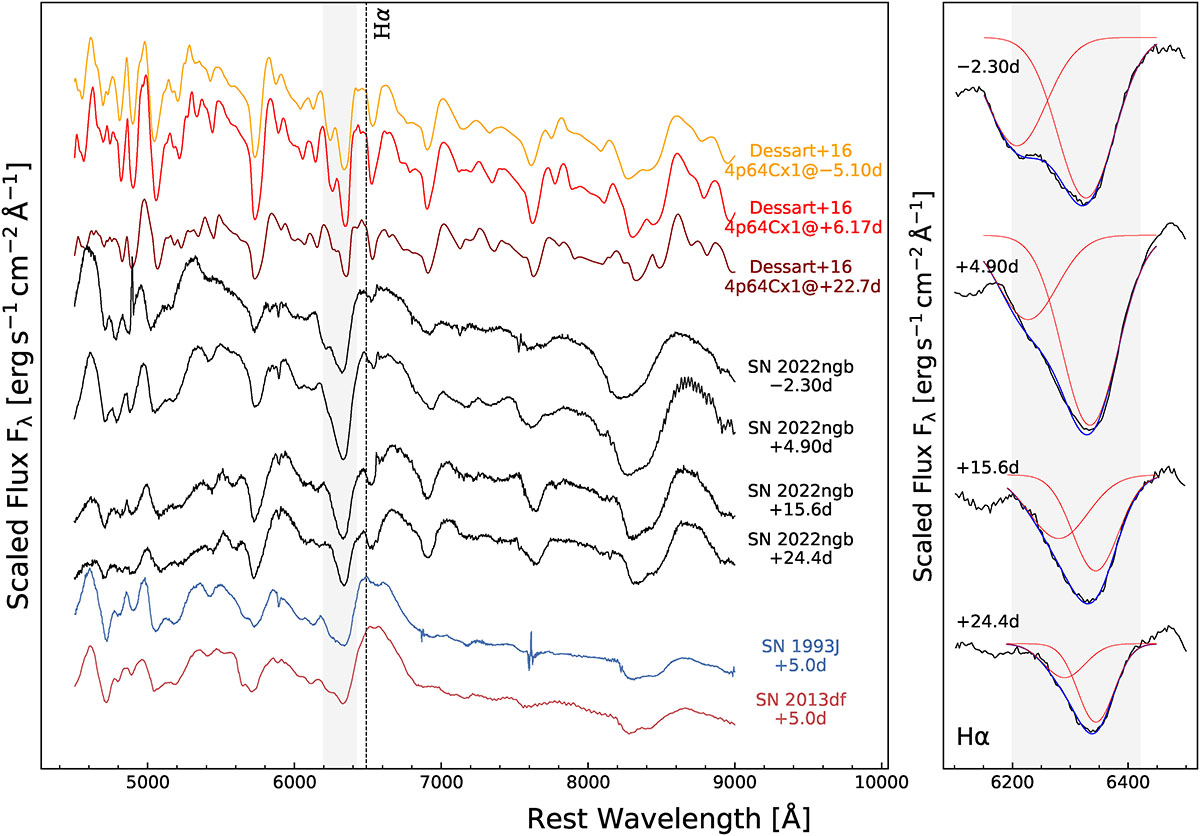
Left panel: Comparison of spectra of SN 2022ngb obtained near maximum light with spectra of the SNe IIb 1993J and 2013df, and synthetic spectra from the NLTE models of Dessart et al. (2016). The models shown correspond to a progenitor with a pre-explosion mass of 4.64 M⊙. The rest wavelength position of Hα is marked with a dotted vertical line. Right panel: Details of the evolution of the Hα absorption. Its profile is fitted with a double-Gaussian function (blue solid line), whose individual components are shown with red solid lines.
Current usage metrics show cumulative count of Article Views (full-text article views including HTML views, PDF and ePub downloads, according to the available data) and Abstracts Views on Vision4Press platform.
Data correspond to usage on the plateform after 2015. The current usage metrics is available 48-96 hours after online publication and is updated daily on week days.
Initial download of the metrics may take a while.