Open Access
Fig. 18.
Download original image
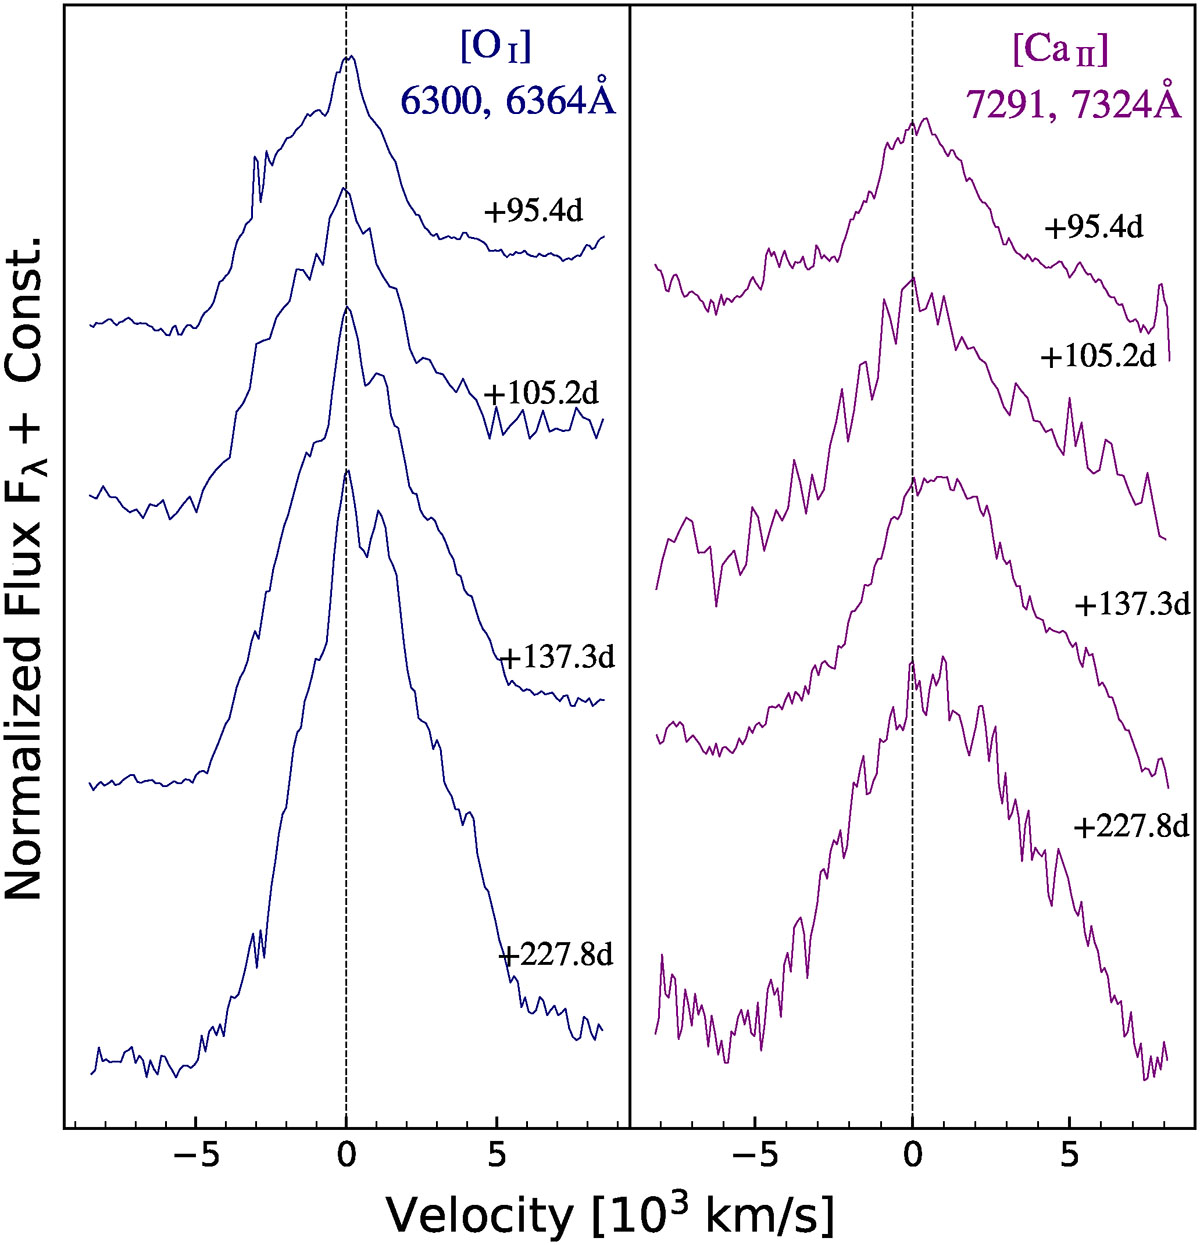
Evolution of the profiles of the [O I] λλ6300, 6364 Å doublet (left panel), and the [Ca II] λλ7291, 7324 Å doublet (right panel). The rest wavelength for each line is marked by a vertical dashed line. The observational epoch is indicated to the right of each spectrum.
Current usage metrics show cumulative count of Article Views (full-text article views including HTML views, PDF and ePub downloads, according to the available data) and Abstracts Views on Vision4Press platform.
Data correspond to usage on the plateform after 2015. The current usage metrics is available 48-96 hours after online publication and is updated daily on week days.
Initial download of the metrics may take a while.