Fig. 5.
Download original image
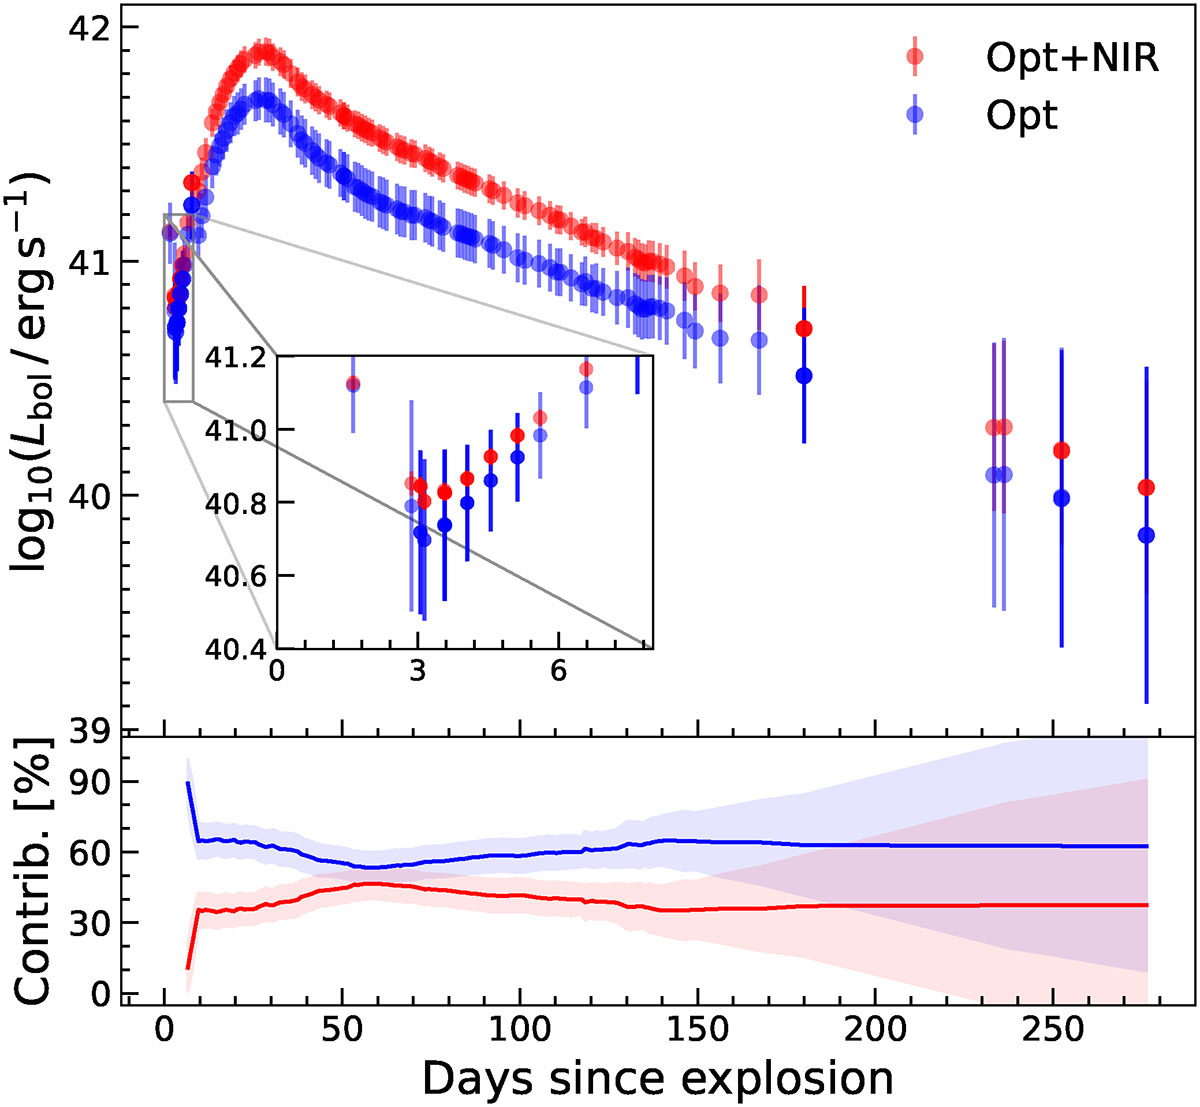
Pseudo-bolometric light curve of SN 2022ngb. Top panels: Light curve constructed using optical and NIR data only. Bottom panels: Evolution of the contribution of the individual wavelength ranges (blue corresponds to the optical and the red to NIR) with time of the pseudo-bolometric luminosity. The blue points stand for the pseudo-bolometric light curve solely constructed using optical data, while the red points represent the pseudo-bolometric light curve constructed with optical and NIR data.
Current usage metrics show cumulative count of Article Views (full-text article views including HTML views, PDF and ePub downloads, according to the available data) and Abstracts Views on Vision4Press platform.
Data correspond to usage on the plateform after 2015. The current usage metrics is available 48-96 hours after online publication and is updated daily on week days.
Initial download of the metrics may take a while.