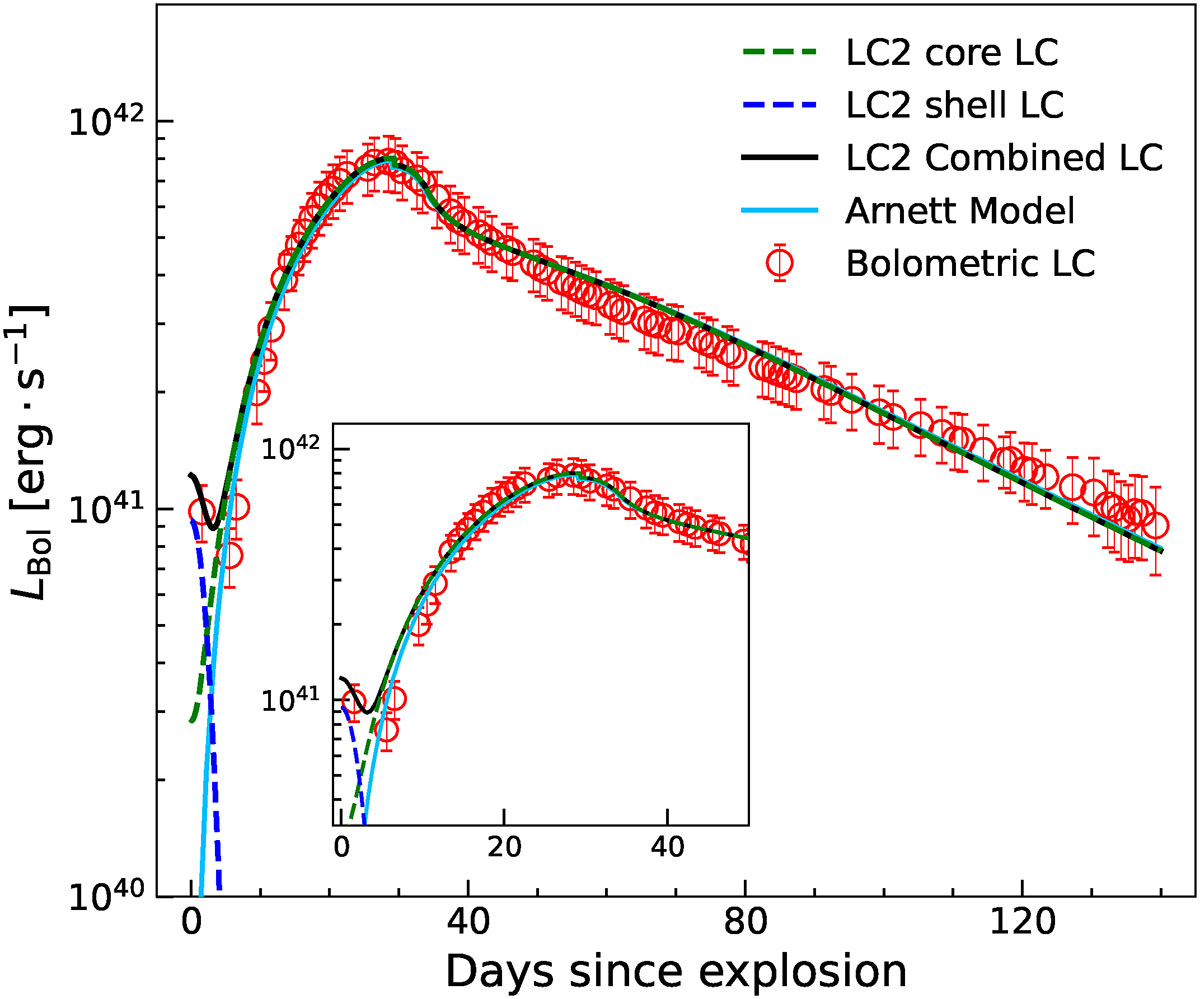
Fig. 7.
Download original image
Bolometric light curve fitting result for SN 2022ngb (red dots). The black solid line stands for the fitting result of the two-component model. Green and blue dashed lines stand for the contribution of the He-rich core and the H-rich shell, respectively. The cyan solid line is the result of the Arnett-like model fitting result. The inset shows the bolometric light curve of SN 2022ngb along with the fitting result up to ∼50 days from explosion.
Current usage metrics show cumulative count of Article Views (full-text article views including HTML views, PDF and ePub downloads, according to the available data) and Abstracts Views on Vision4Press platform.
Data correspond to usage on the plateform after 2015. The current usage metrics is available 48-96 hours after online publication and is updated daily on week days.
Initial download of the metrics may take a while.