Fig. 9.
Download original image
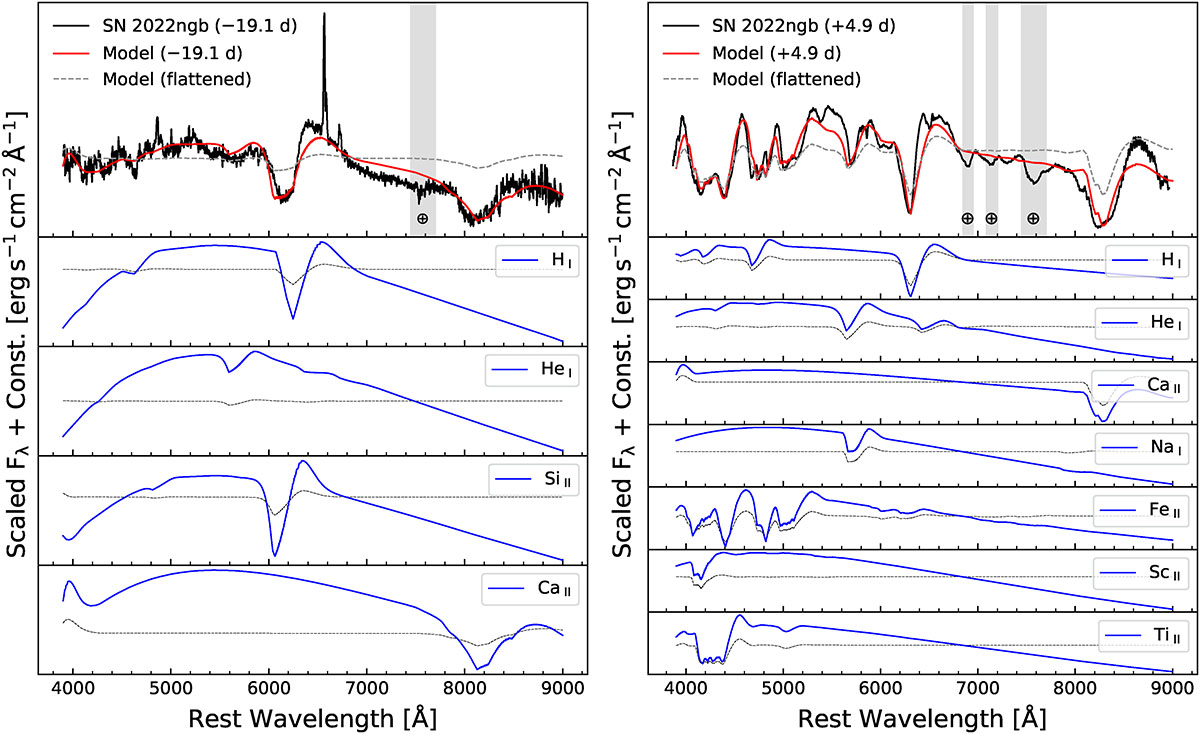
Early (−19.1 days from V-band maximum; top-left panel) and near maximum (+4.9 days from V-band maximum; top-right panel) spectra of SN 2022ngb compared with spectral models generated by SYN++. Solid lines represent the best-fit models, while the dashed lines present the continuum-subtracted result. The most important contributing species are shown in the lower panels.
Current usage metrics show cumulative count of Article Views (full-text article views including HTML views, PDF and ePub downloads, according to the available data) and Abstracts Views on Vision4Press platform.
Data correspond to usage on the plateform after 2015. The current usage metrics is available 48-96 hours after online publication and is updated daily on week days.
Initial download of the metrics may take a while.