Fig. 2
Download original image
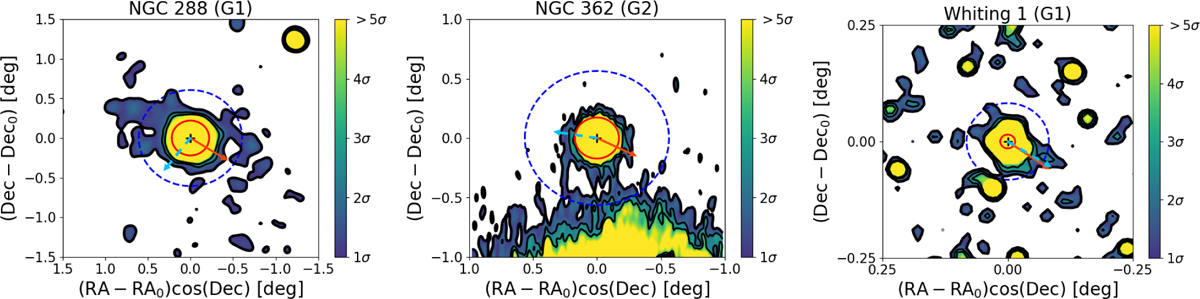
Signal-to-noise ratio distributions for part of the cluster sample, derived from the matched-filter output. The red circle indicates the King tidal radius (![]() ) from the Harris catalog, while the dashed blue circle represents the dynamical tidal radius (rtdyn) from the globular cluster database. The solid orange arrow points toward the Galactic center, and the dashed light-blue arrow indicates the direction of the cluster’s orbital motion over a short timescale. The black contours correspond to significance levels from 1σ to 3σ, with the outermost 1σ contour shown in bold. S/N distributions for the remaining clusters are shown in Fig. B.2.
) from the Harris catalog, while the dashed blue circle represents the dynamical tidal radius (rtdyn) from the globular cluster database. The solid orange arrow points toward the Galactic center, and the dashed light-blue arrow indicates the direction of the cluster’s orbital motion over a short timescale. The black contours correspond to significance levels from 1σ to 3σ, with the outermost 1σ contour shown in bold. S/N distributions for the remaining clusters are shown in Fig. B.2.
Current usage metrics show cumulative count of Article Views (full-text article views including HTML views, PDF and ePub downloads, according to the available data) and Abstracts Views on Vision4Press platform.
Data correspond to usage on the plateform after 2015. The current usage metrics is available 48-96 hours after online publication and is updated daily on week days.
Initial download of the metrics may take a while.