Open Access
Fig. 2
Download original image
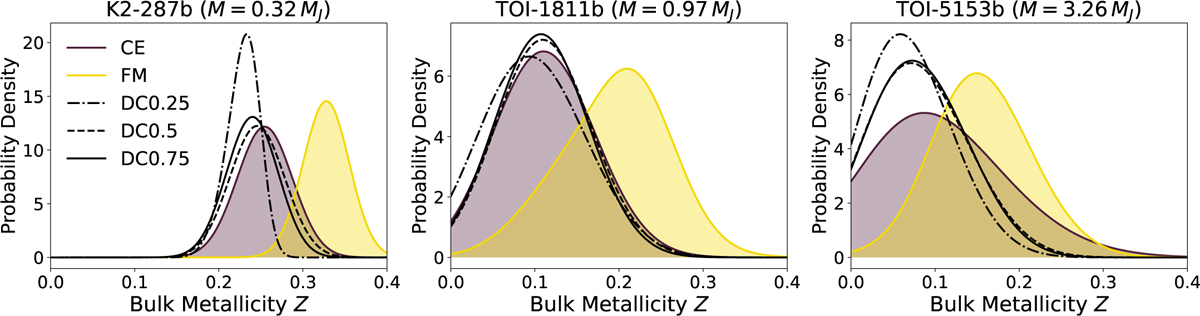
Retrieved curves for CE, FM, and DC0.25–0.5–0.75 structures (varying mdilute values) across three different planetary cases for different masses. The CE curves are shown in purple, FM in yellow, and DC in black, and can be distinguished through the different line style.
Current usage metrics show cumulative count of Article Views (full-text article views including HTML views, PDF and ePub downloads, according to the available data) and Abstracts Views on Vision4Press platform.
Data correspond to usage on the plateform after 2015. The current usage metrics is available 48-96 hours after online publication and is updated daily on week days.
Initial download of the metrics may take a while.