Fig. 7
Download original image
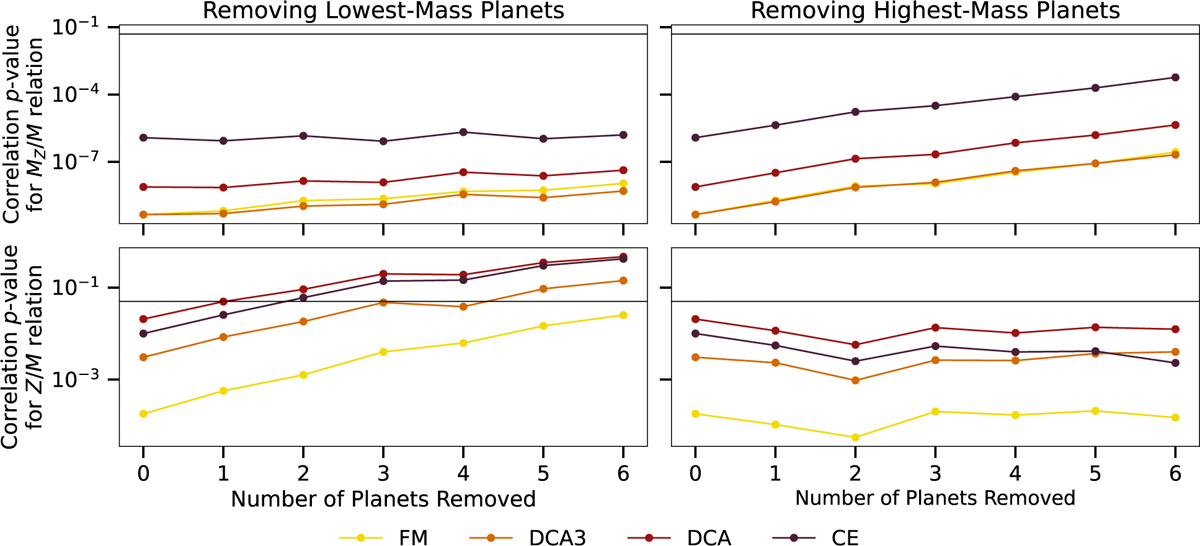
Kendall’s τ correlation p-value for MZ/M and Z/M with n-planets removed from the initial dataset. Planets are removed from the lowest-mass (left) and highest-mass (right) planets. The number of planets being iteratively removed can be seen on the x-axis. The four different models are respectively colour-coded. The horizontal line shows the p = 0.05 acceptance threshold.
Current usage metrics show cumulative count of Article Views (full-text article views including HTML views, PDF and ePub downloads, according to the available data) and Abstracts Views on Vision4Press platform.
Data correspond to usage on the plateform after 2015. The current usage metrics is available 48-96 hours after online publication and is updated daily on week days.
Initial download of the metrics may take a while.