Fig. A.2.
Download original image
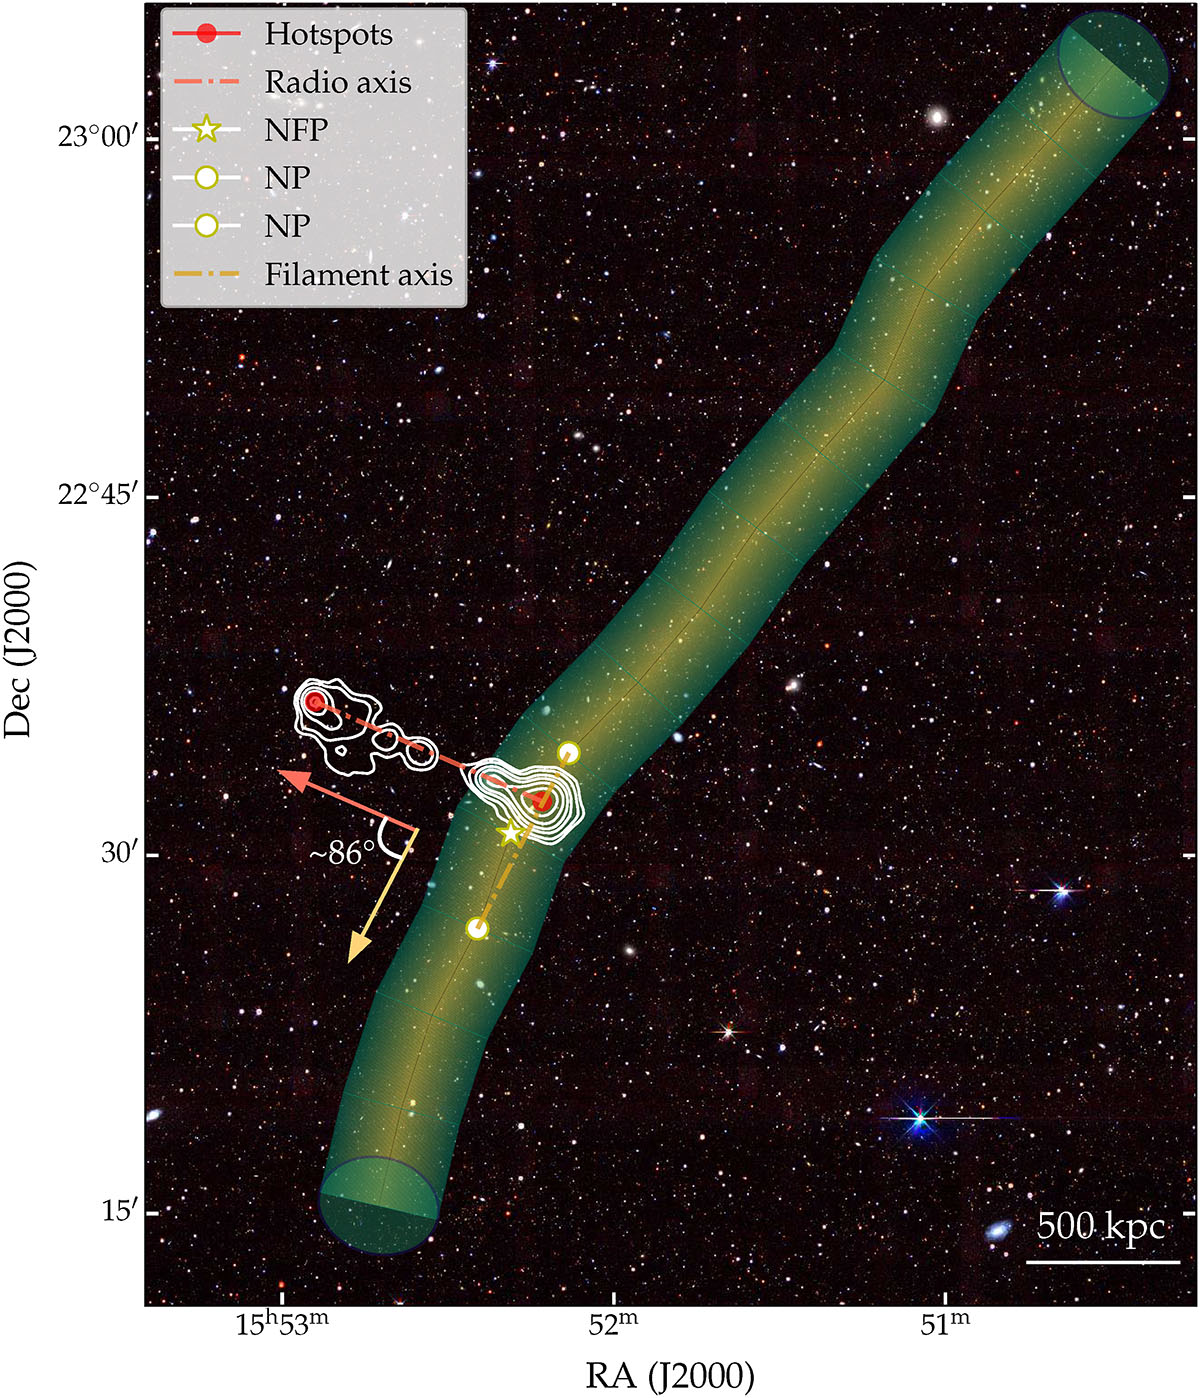
Same plotting conventions as in Fig. A.1. This figure shows the GRG at RA: 238.0931°, Dec: 22.5533°. White NVSS 1400 MHz contours (beam = 45″, σ ∼ 0.45 mJy beam−1) above 3σ are overlaid on the Legacy Surveys RGB image. The nearest filament is traced over its inner 400 kpc, the yellow star marks the NFP with neighbouring points (NP) indicated by white circles. The GRG jet axis is nearly perpendicular to the filament, forming an angle of ∼86° with the filament axis. Red circles denote the hotspot positions. The radio axis and filament axis are shown by dashed red and yellow lines, respectively, with the same coloured arrows drawn parallel to each. The angle between the two arrows measures the alignment of the GRG with the filament on the plane of the sky.
Current usage metrics show cumulative count of Article Views (full-text article views including HTML views, PDF and ePub downloads, according to the available data) and Abstracts Views on Vision4Press platform.
Data correspond to usage on the plateform after 2015. The current usage metrics is available 48-96 hours after online publication and is updated daily on week days.
Initial download of the metrics may take a while.