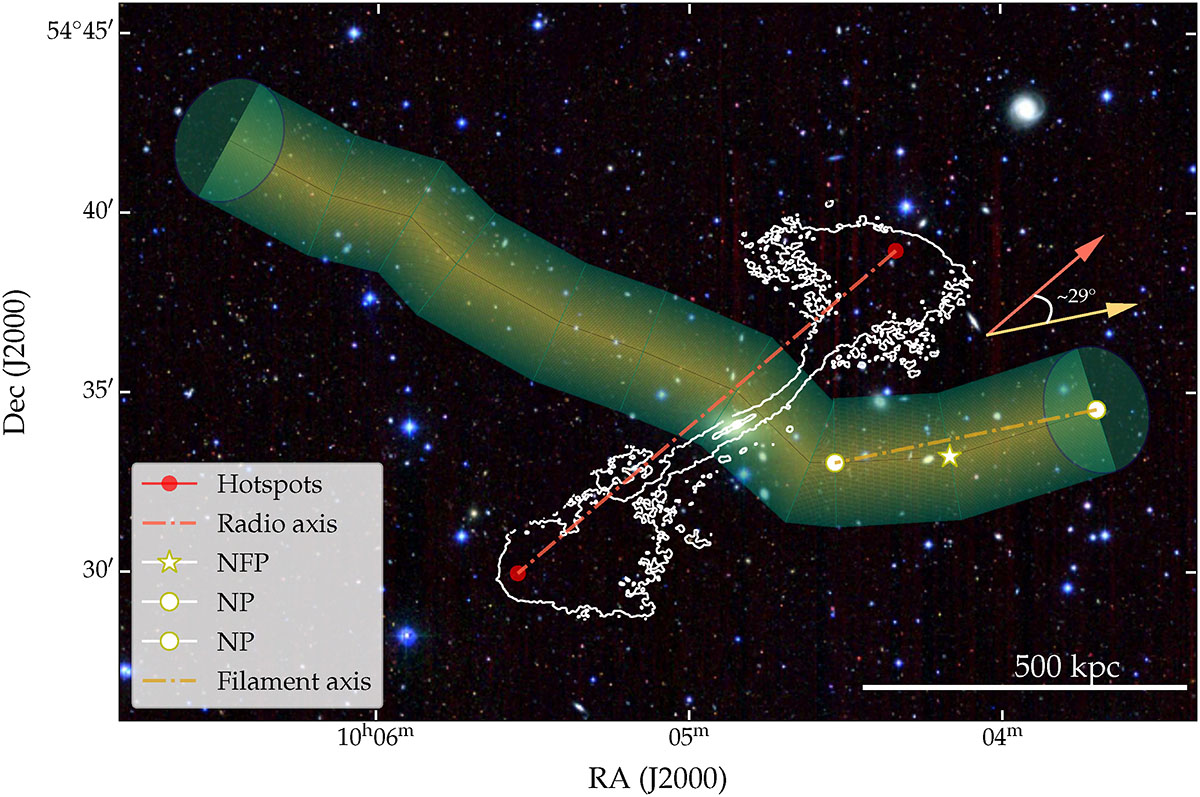
Fig. A.3.
Download original image
As in Fig. A.1 but for the GRG at RA: 151.2168°, Dec: 54.5678°. Here, the radio map is from LoTSS at 144 MHz with a 6″ beam, shown as white contours above 3σ (σ ∼ 50 μJy beam−1). The filament spine is traced over its inner 200 kpc, the yellow star marks the NFP and its neighbouring points (NP) are plotted as white circles. The GRG jet axis forms an angle of ∼29° with the filament axis. Red circles mark the hotspot positions. The background is the Legacy Surveys optical RGB image of the sky. The dashed lines indicate the radio (red) and filament (yellow) axes; corresponding red and yellow arrows are drawn parallel to them. The angle between the arrows represents the GRG-filament alignment on the plane of the sky.
Current usage metrics show cumulative count of Article Views (full-text article views including HTML views, PDF and ePub downloads, according to the available data) and Abstracts Views on Vision4Press platform.
Data correspond to usage on the plateform after 2015. The current usage metrics is available 48-96 hours after online publication and is updated daily on week days.
Initial download of the metrics may take a while.