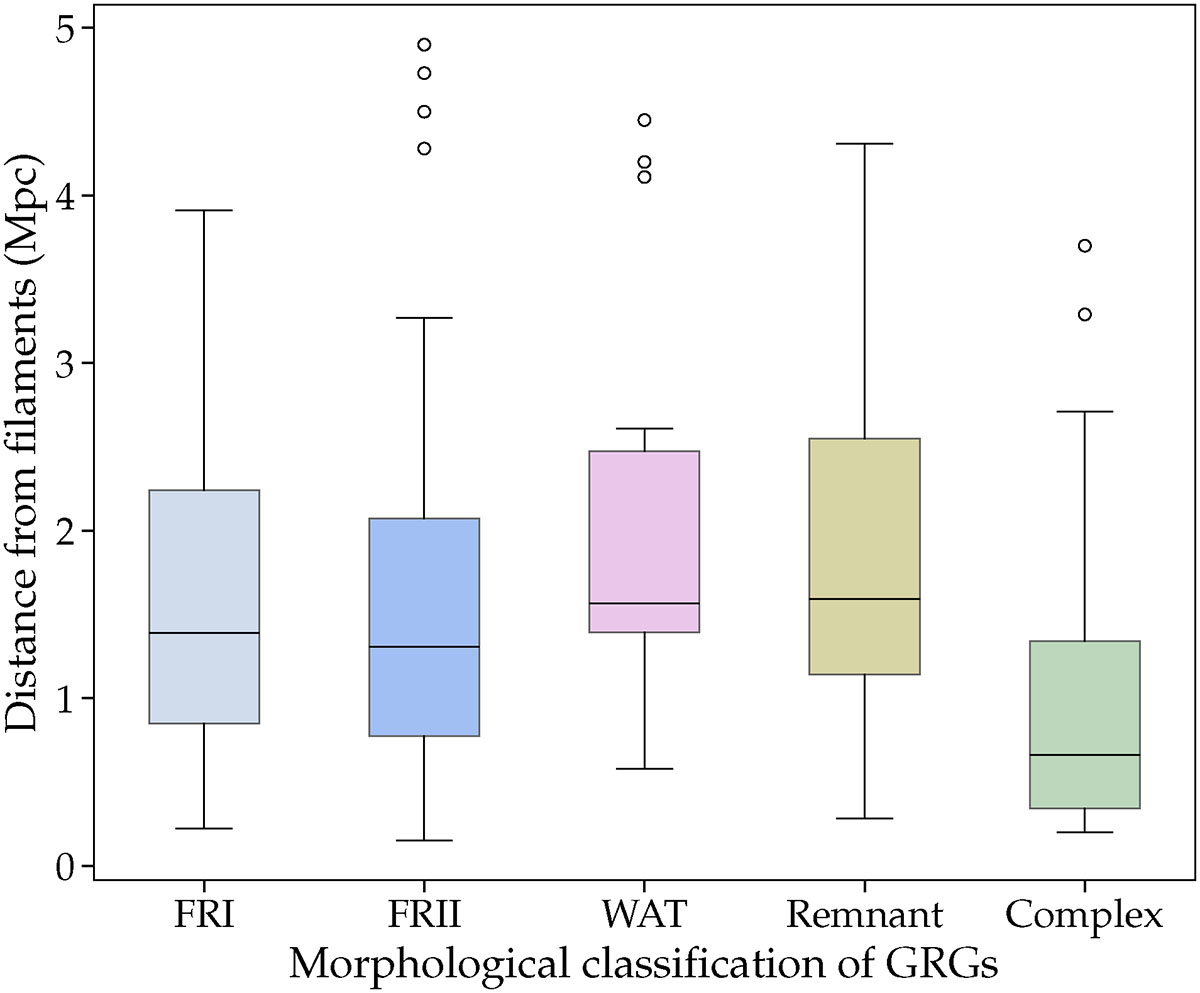
Fig. 3.
Download original image
Box-and-whisker plots present the distributions of distances from filaments for different morphological classes of GRGs: FRI, FRII, WAT, remnant sources, and complex. The solid black line within a box indicates the median of the distribution, the lower and the upper box boundaries represent the 25th percentile (Q1) and 75th percentile (Q3); therefore, the box shows the interquartile (IQR) range of the data. The whiskers denote the range of the distribution within 1.5 × IQR, while the circles represent the outliers. As the data are not symmetrically distributed, the whiskers are of unequal length, reflecting the variability above and below the median value. The asymmetry, therefore, indicates skewness or unequal variability in two directions.
Current usage metrics show cumulative count of Article Views (full-text article views including HTML views, PDF and ePub downloads, according to the available data) and Abstracts Views on Vision4Press platform.
Data correspond to usage on the plateform after 2015. The current usage metrics is available 48-96 hours after online publication and is updated daily on week days.
Initial download of the metrics may take a while.