Open Access
Fig. 4.
Download original image
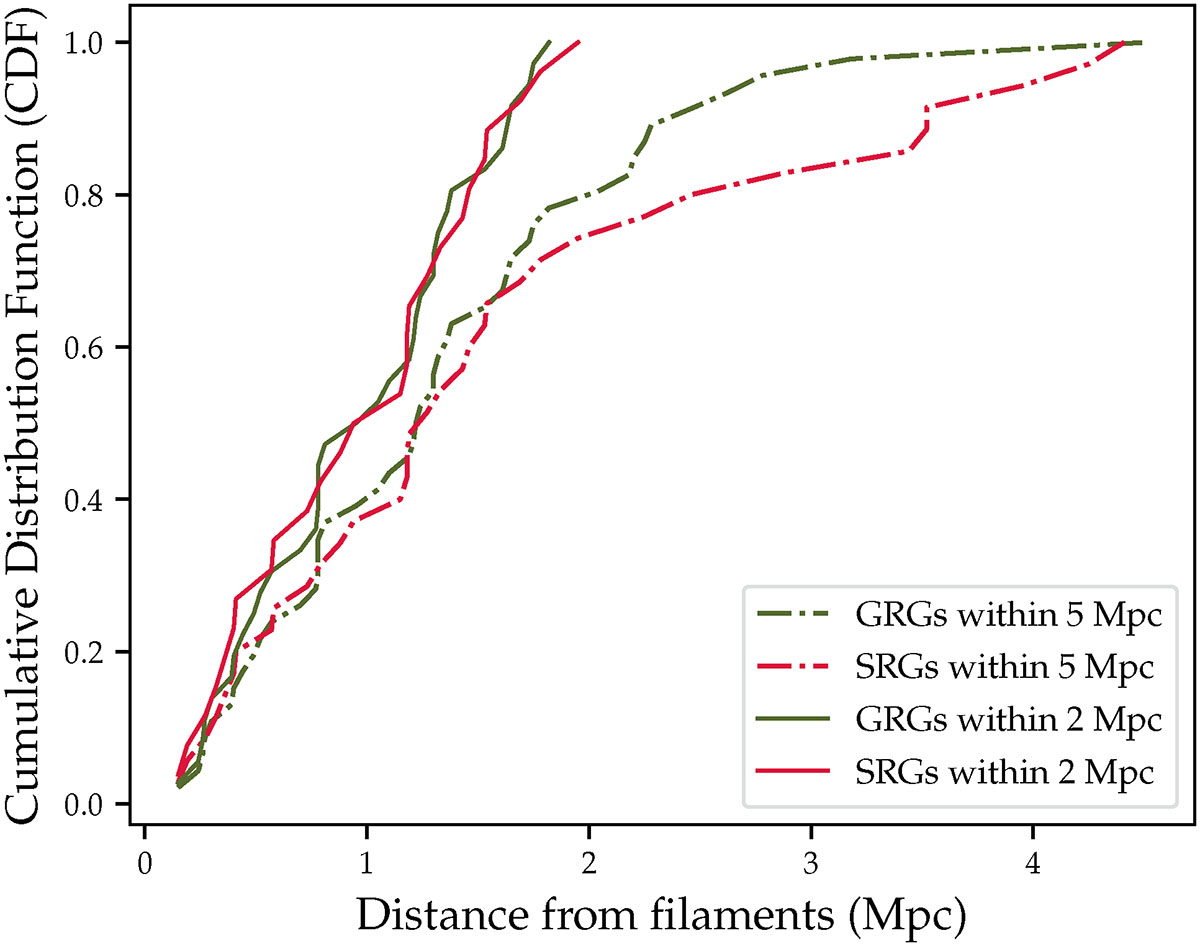
Cumulative distribution functions (CDFs) of the 3D distances to the nearest filament spine for GRGs (green) and SRGs (red). For each population, the solid curves correspond to sources within 2 Mpc of the spine and the dashed curves to sources within 5 Mpc.
Current usage metrics show cumulative count of Article Views (full-text article views including HTML views, PDF and ePub downloads, according to the available data) and Abstracts Views on Vision4Press platform.
Data correspond to usage on the plateform after 2015. The current usage metrics is available 48-96 hours after online publication and is updated daily on week days.
Initial download of the metrics may take a while.