Fig. 7.
Download original image
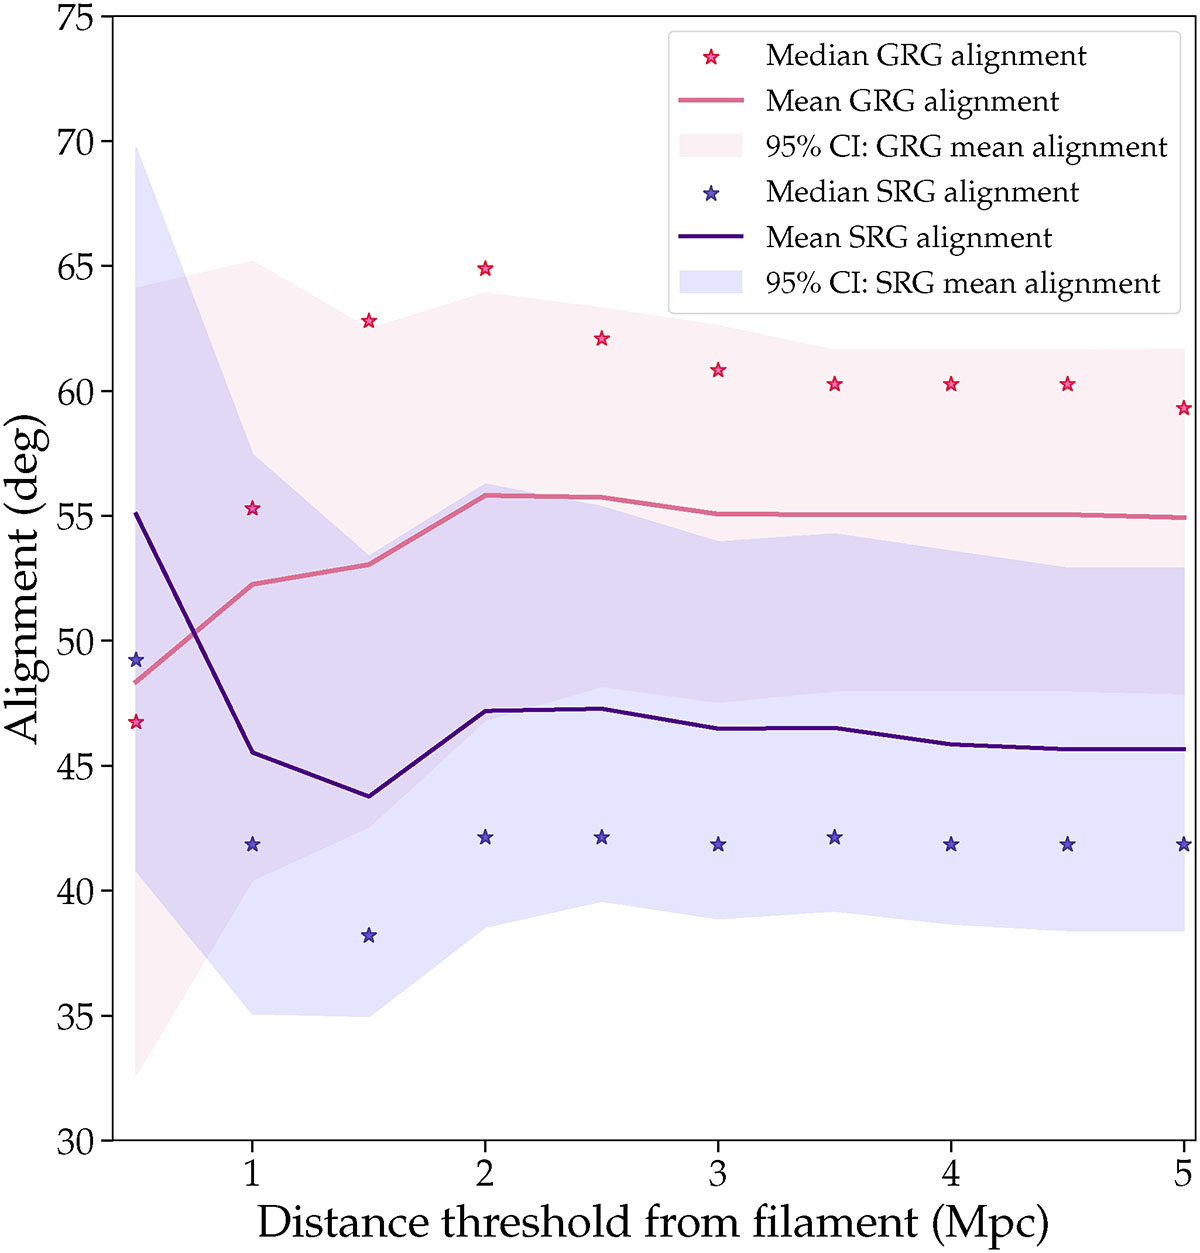
Change in GRG and SRG mean jet-alignments with distance threshold from filaments. The solid red curve traces the GRG mean, the shaded pink region denotes the 95% bootstrap CI, and red stars mark the median alignment in each distance bin. The solid blue curve represents the SRG mean, the lavender band shows the 95% bootstrap CI, and blue stars mark the corresponding medians.
Current usage metrics show cumulative count of Article Views (full-text article views including HTML views, PDF and ePub downloads, according to the available data) and Abstracts Views on Vision4Press platform.
Data correspond to usage on the plateform after 2015. The current usage metrics is available 48-96 hours after online publication and is updated daily on week days.
Initial download of the metrics may take a while.