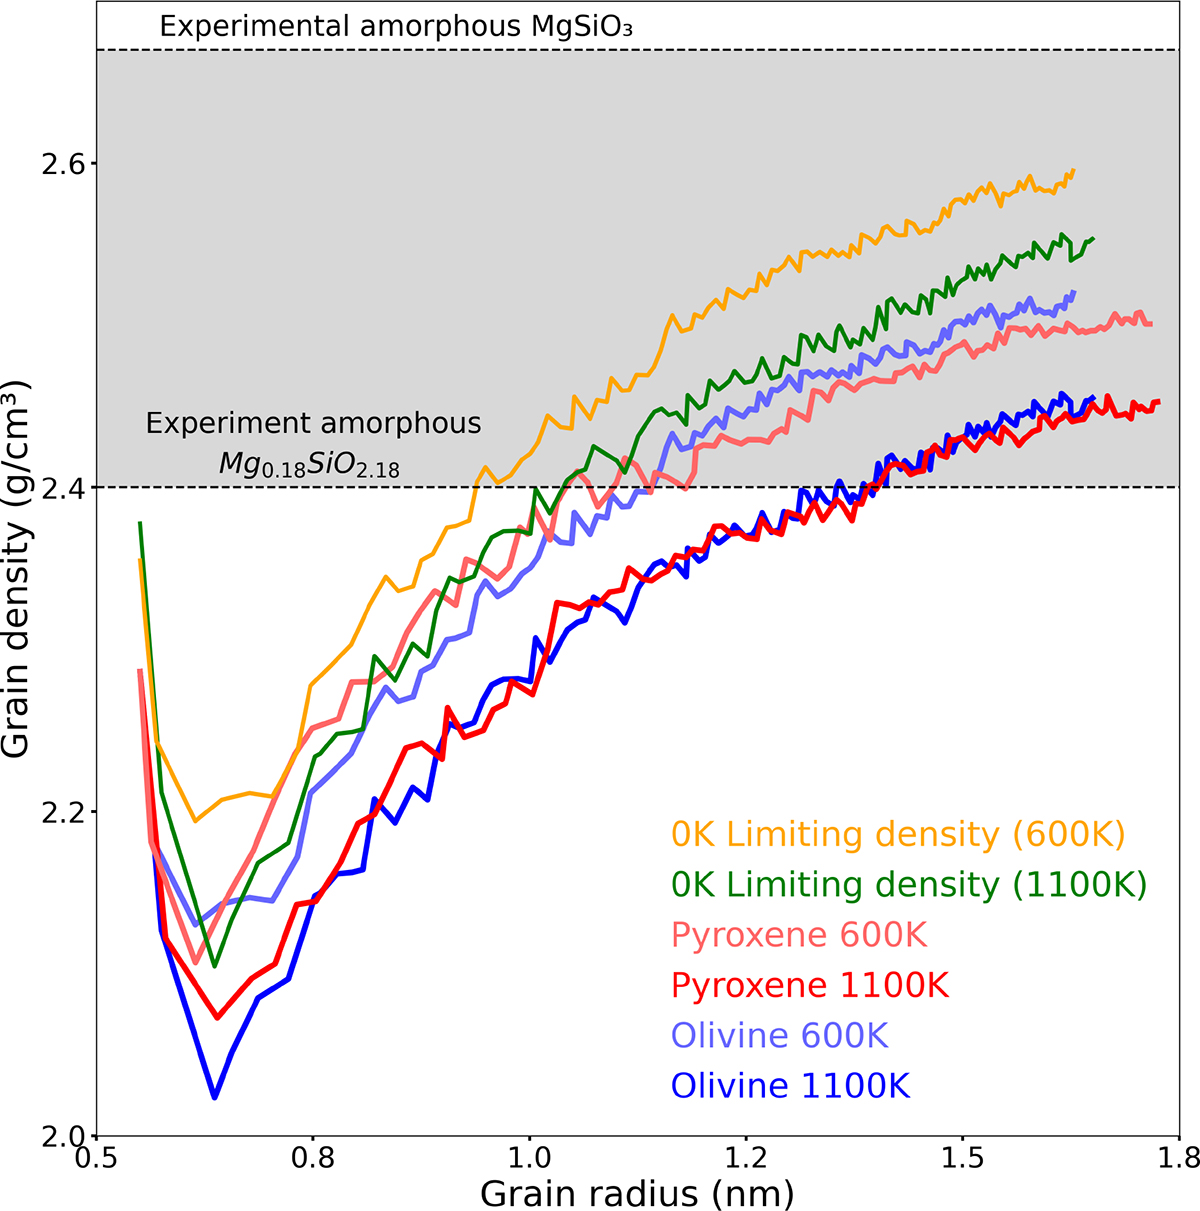
Fig. 12.
Download original image
Evolution of grain density for pyroxenic (red) and olivinic (blue) grains at 600 K and 1100 K. The shaded grey area corresponds to a range of experimentally measured densities of bulk Mg-silicate glasses reported in Jiang et al. (2023). Orange and green lines indicate the limiting density when optimizing the grain’s structure at 0 K for the grains obtained at 600K and 1100K, respectively.
Current usage metrics show cumulative count of Article Views (full-text article views including HTML views, PDF and ePub downloads, according to the available data) and Abstracts Views on Vision4Press platform.
Data correspond to usage on the plateform after 2015. The current usage metrics is available 48-96 hours after online publication and is updated daily on week days.
Initial download of the metrics may take a while.