Open Access
Fig. G.1.
Download original image
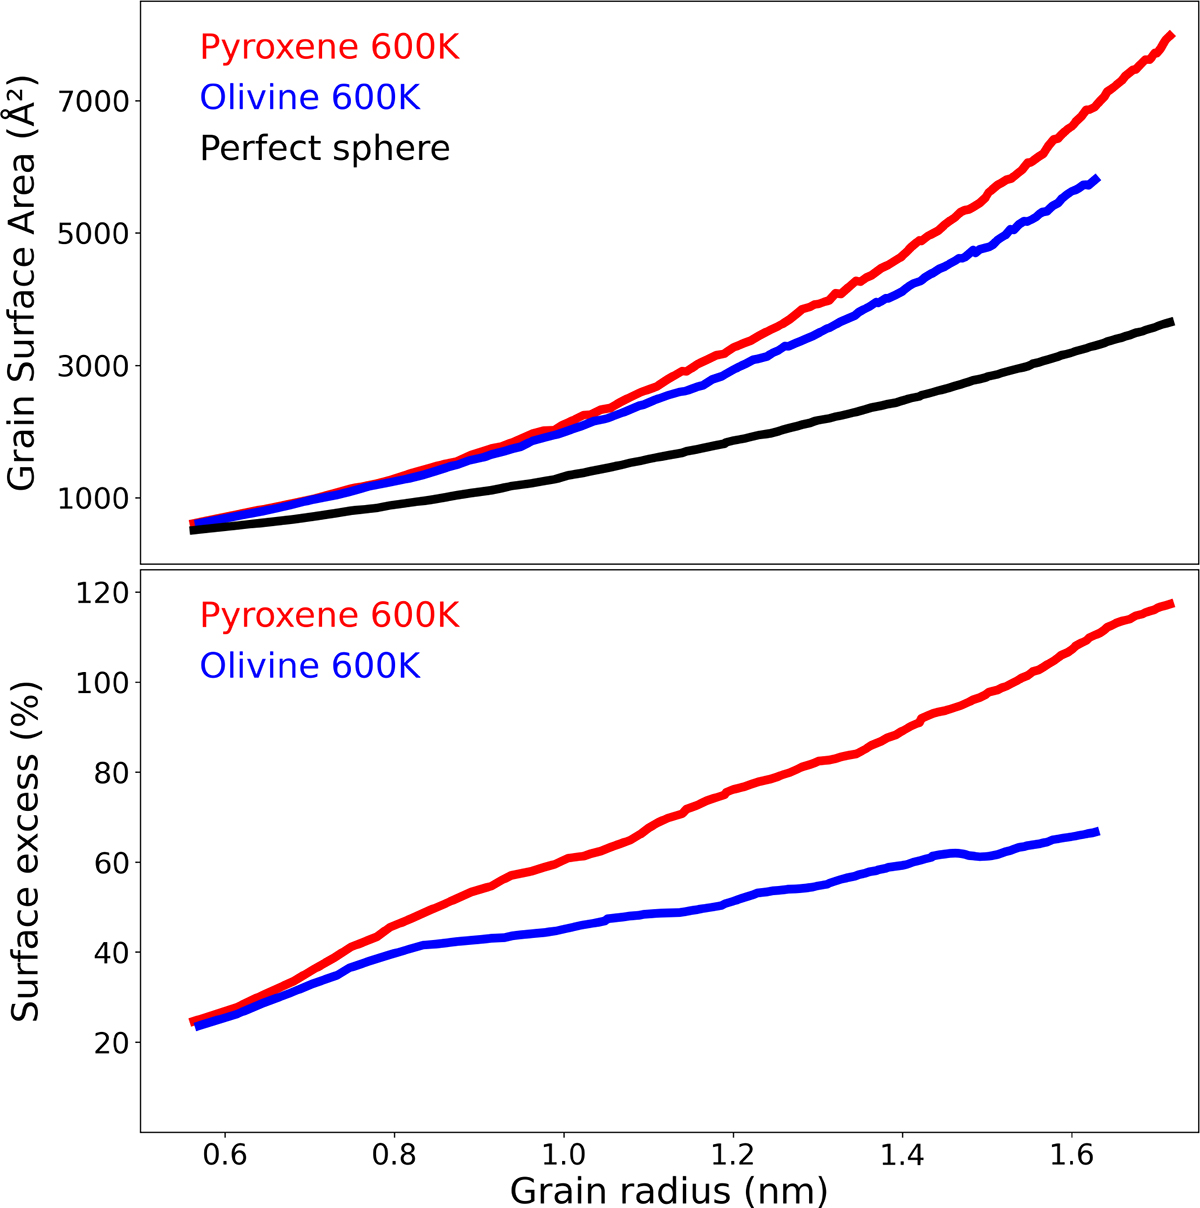
Top: Surface area of growing pyroxenic (red) and olivine (blue) grains grown at 600K, and of a sphere with same radius as the grain (black). Bottom: Percentage of excess surface area of the grains with respect to the corresponding sphere. The results are obtained from averages over ten NAGGS simulations.
Current usage metrics show cumulative count of Article Views (full-text article views including HTML views, PDF and ePub downloads, according to the available data) and Abstracts Views on Vision4Press platform.
Data correspond to usage on the plateform after 2015. The current usage metrics is available 48-96 hours after online publication and is updated daily on week days.
Initial download of the metrics may take a while.