Fig. 1.
Download original image
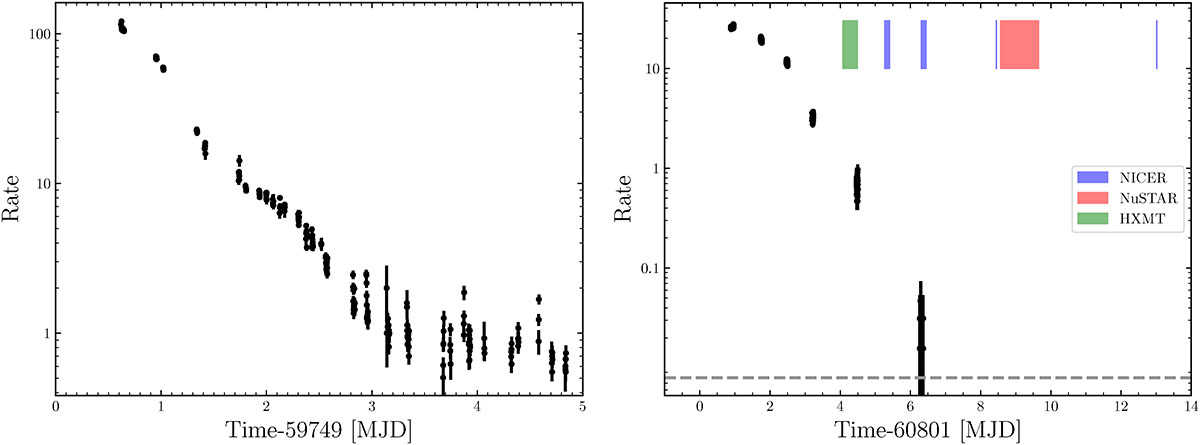
Light curves of MAXI J1957+032 from NICER (left panel, 0.5–10 keV), and EP (right panel, 0.5–10 keV) during its 2022 and 2025 outbursts, respectively. The vertical axes display the total count rate (source plus background) in units of counts per second on a logarithmic scale. In the right panel, the shaded rectangles mark the observational intervals of NICER (blue), NuSTAR (red), and Insight-HXMT (green). The dashed horizontal line indicates the background level for the EP observations.
Current usage metrics show cumulative count of Article Views (full-text article views including HTML views, PDF and ePub downloads, according to the available data) and Abstracts Views on Vision4Press platform.
Data correspond to usage on the plateform after 2015. The current usage metrics is available 48-96 hours after online publication and is updated daily on week days.
Initial download of the metrics may take a while.