Fig. 4.
Download original image
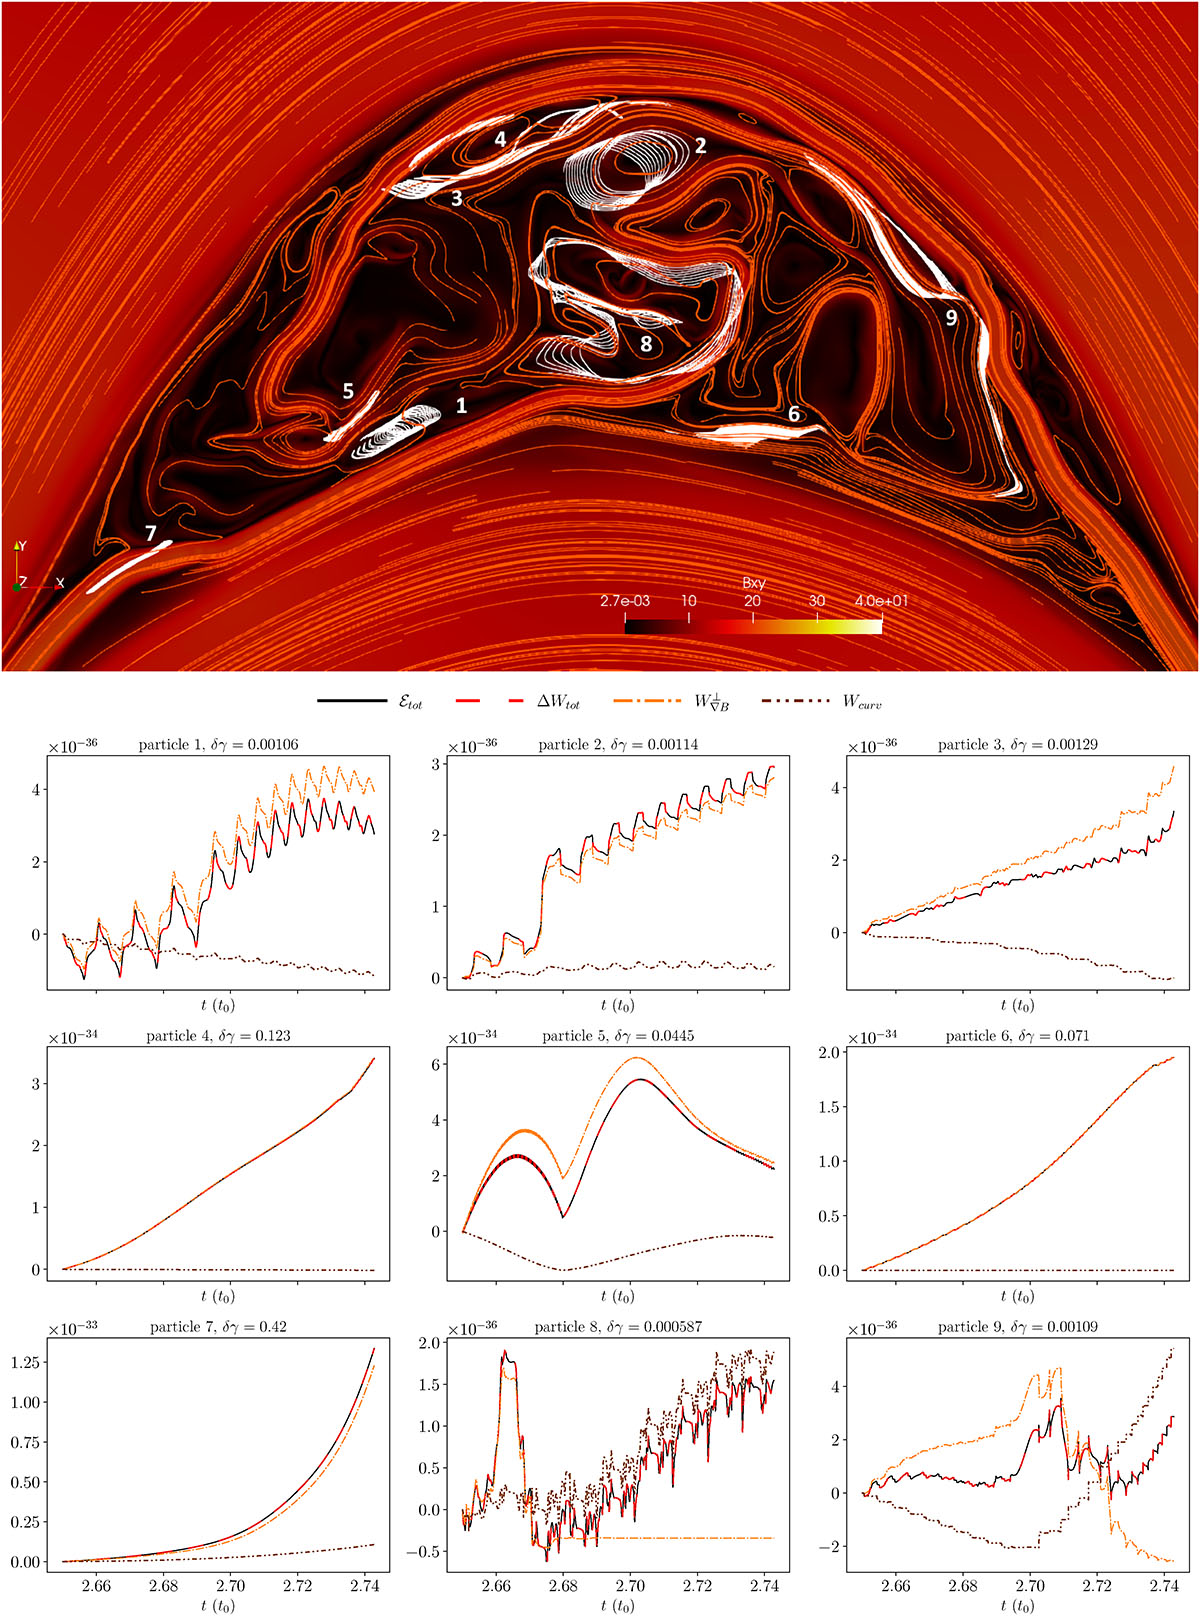
Top panel: trajectories of 9 representative particles during the time interval [2.65 − 2.75] t0 on top of the 2D coronal loop magnetic field structure at t = 2.65t0, coloured by the in-plane field intensity (code units) and threaded by field lines. Bottom: plots of the total energy evolution (integral form of Eq. (6), in code units) decomposed into single-term contributions.
Current usage metrics show cumulative count of Article Views (full-text article views including HTML views, PDF and ePub downloads, according to the available data) and Abstracts Views on Vision4Press platform.
Data correspond to usage on the plateform after 2015. The current usage metrics is available 48-96 hours after online publication and is updated daily on week days.
Initial download of the metrics may take a while.