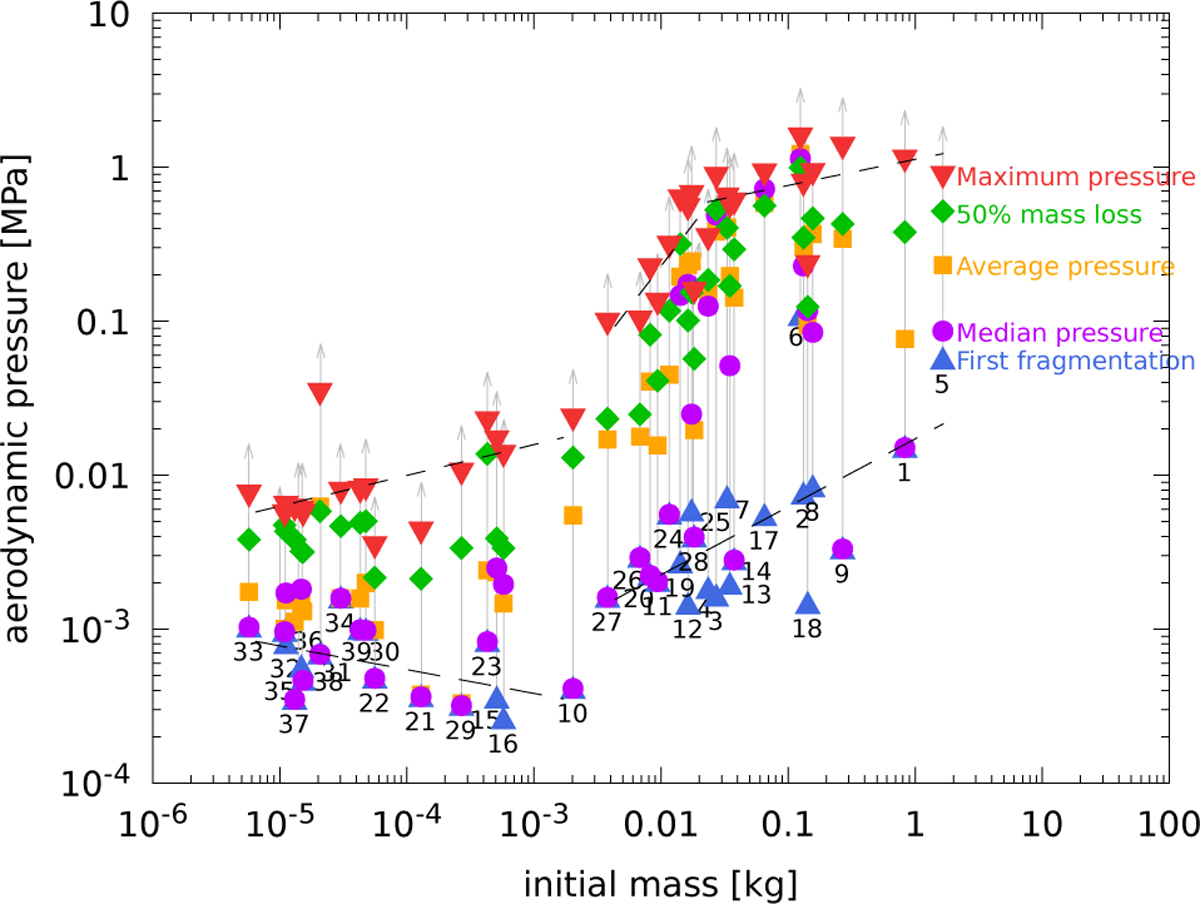
Fig. 4
Download original image
Statistical values of aerodynamic pressure for Geminids. Blue triangles show the pressure for the first observed fragmentation, green diamonds, magenta disks, and orange squares show the average pressure in the volume of meteoroids, calculated in different ways, and red triangles show the maximum attained pressure. The gray arrow indicates that the maximum pressure is only a lower limit. The numbers in the plot are meteor designations from Table 1. The dashed lines are power-law fits to minimum or maximum dynamic pressures. Both axes are logarithmic.
Current usage metrics show cumulative count of Article Views (full-text article views including HTML views, PDF and ePub downloads, according to the available data) and Abstracts Views on Vision4Press platform.
Data correspond to usage on the plateform after 2015. The current usage metrics is available 48-96 hours after online publication and is updated daily on week days.
Initial download of the metrics may take a while.