Fig. 8
Download original image
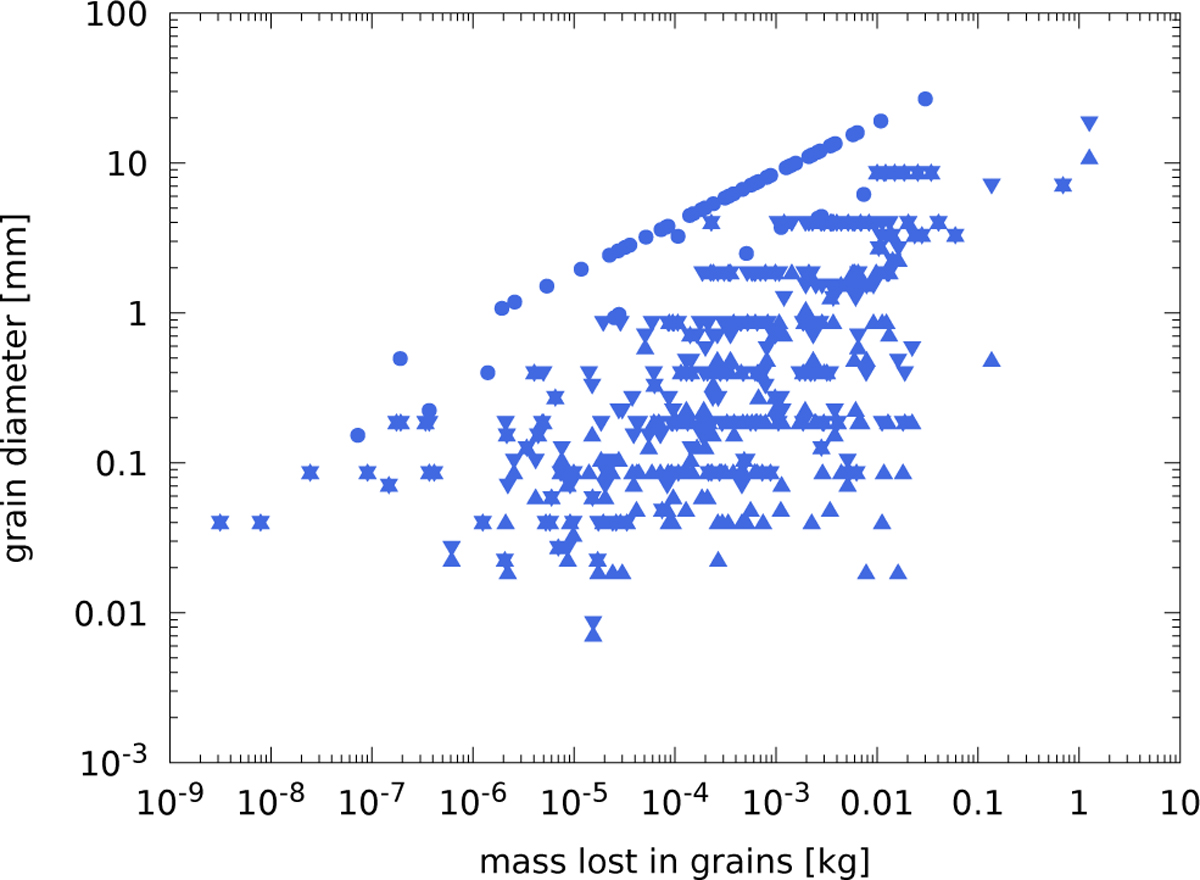
Grain sizes of eroded mass and dust released in gross fragmentation vs. mass lost in such events. Lower grain sizes are shown with ▲, upper grain sizes are shown with ▼. The disks show the sizes of the non-fragmenting parts and lie on a line with a slope of 1/3. Some of the disks lie below this line due to the multiplicity of these fragments (see the text for details). Both axes are logarithmic.
Current usage metrics show cumulative count of Article Views (full-text article views including HTML views, PDF and ePub downloads, according to the available data) and Abstracts Views on Vision4Press platform.
Data correspond to usage on the plateform after 2015. The current usage metrics is available 48-96 hours after online publication and is updated daily on week days.
Initial download of the metrics may take a while.