Open Access
Fig. 5.
Download original image
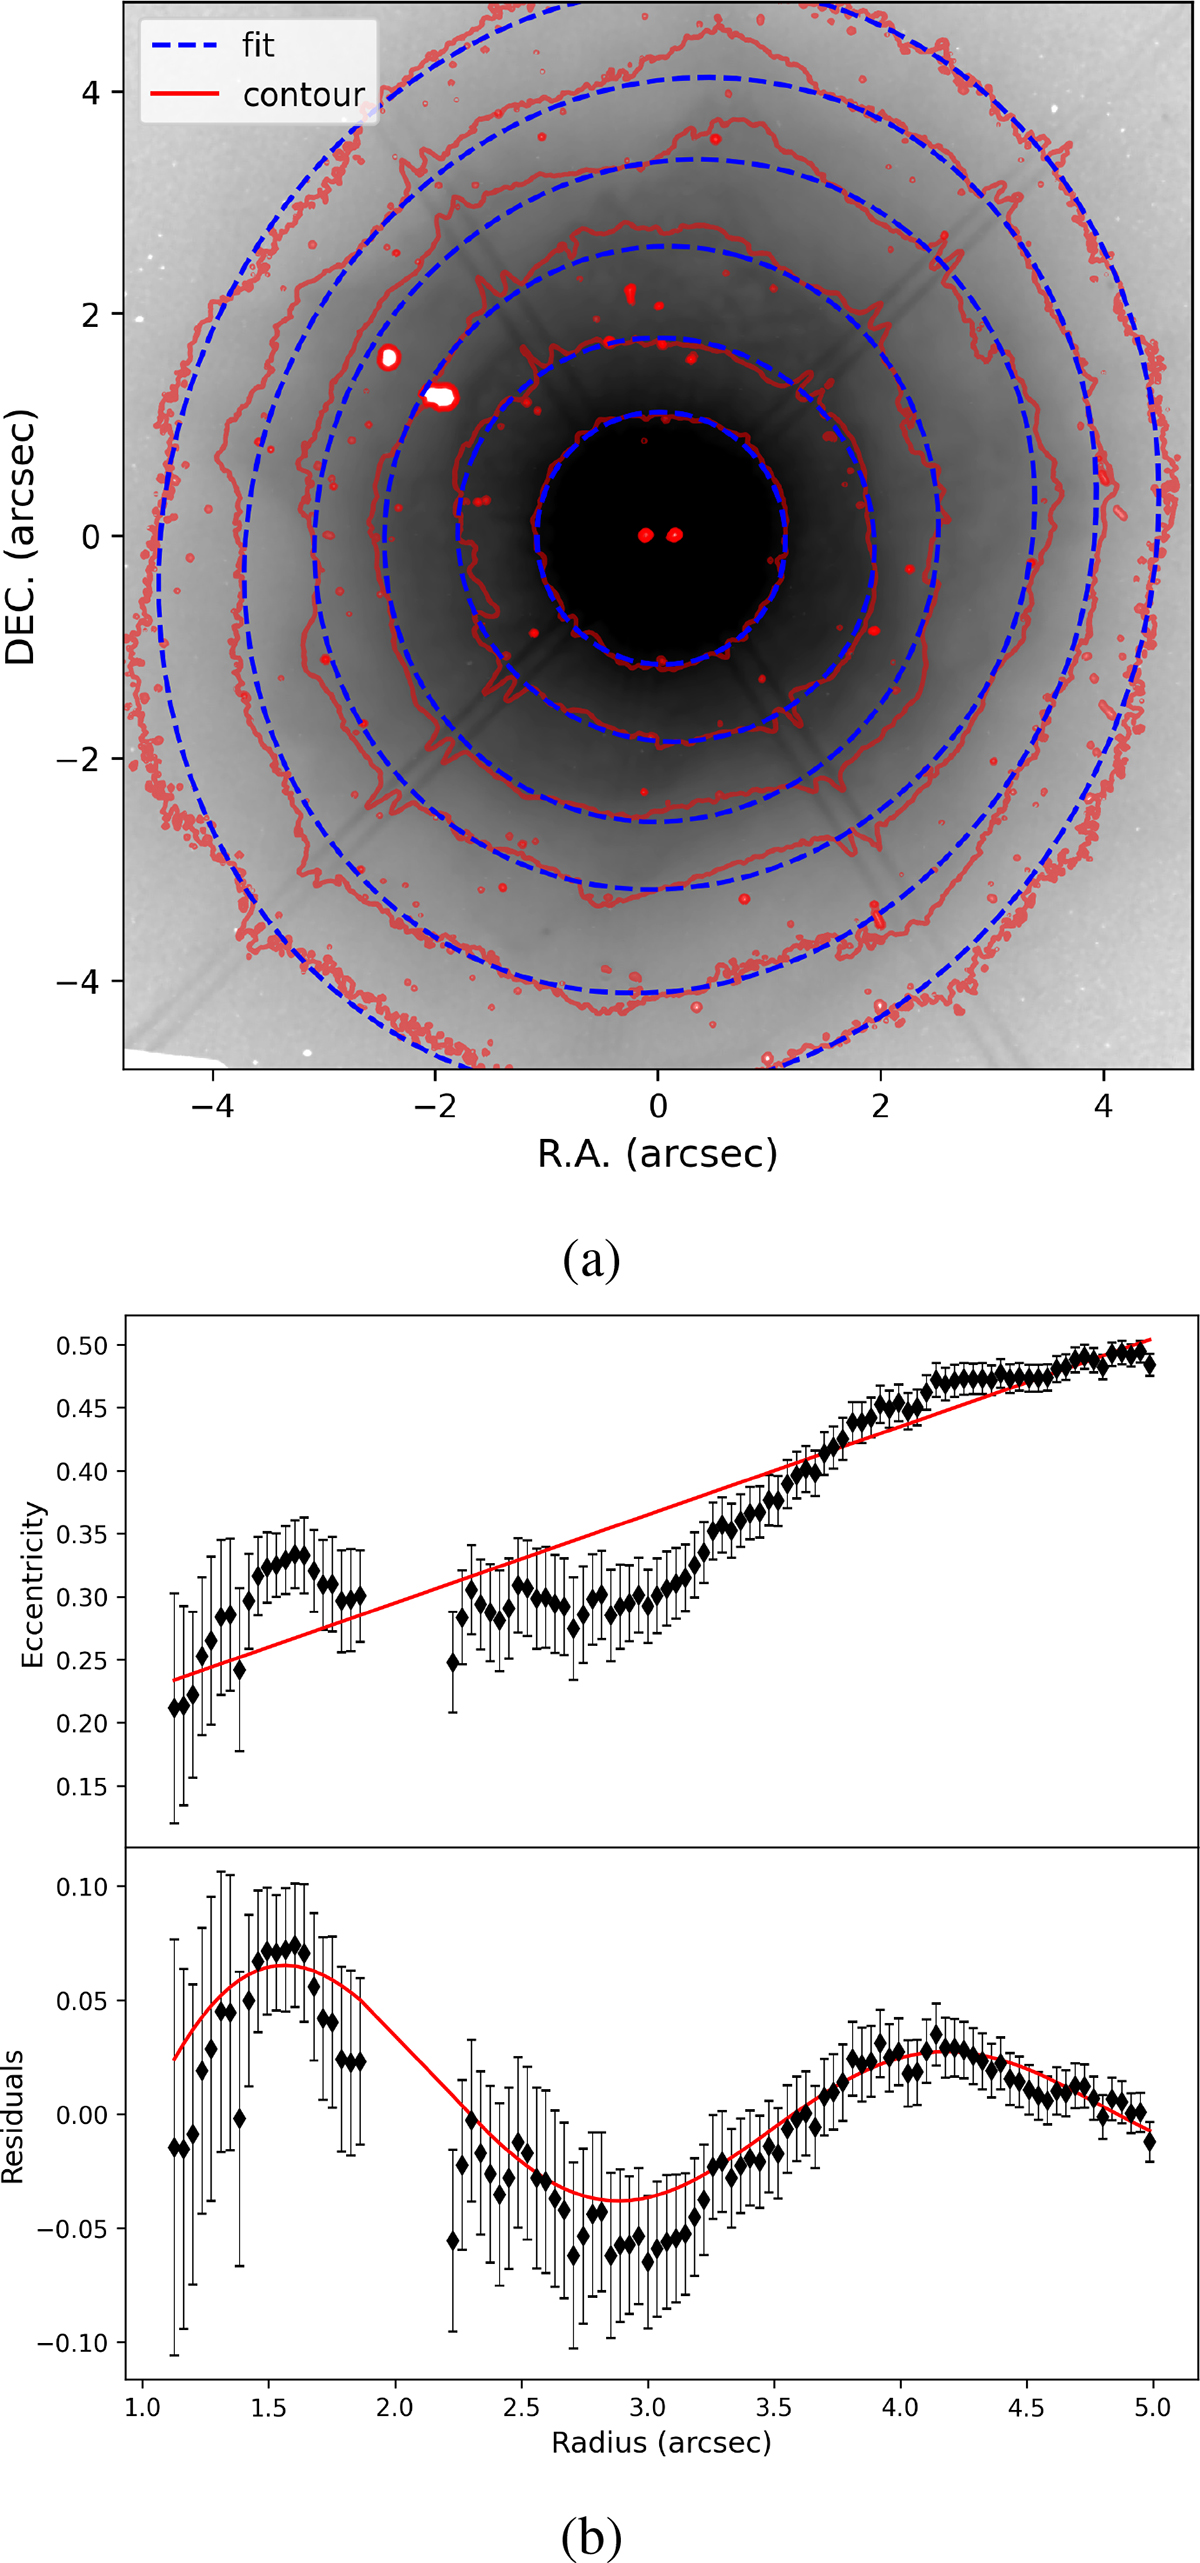
Zoomed-in view of intensity contours of AFGL 4106 nebula in J band is shown in panel a, along with the corresponding eccentricity of these contours in panel b. The top panels present the raw data, while the bottom panels show the residuals after subtracting a linear fit.
Current usage metrics show cumulative count of Article Views (full-text article views including HTML views, PDF and ePub downloads, according to the available data) and Abstracts Views on Vision4Press platform.
Data correspond to usage on the plateform after 2015. The current usage metrics is available 48-96 hours after online publication and is updated daily on week days.
Initial download of the metrics may take a while.