Fig. B.1
Download original image
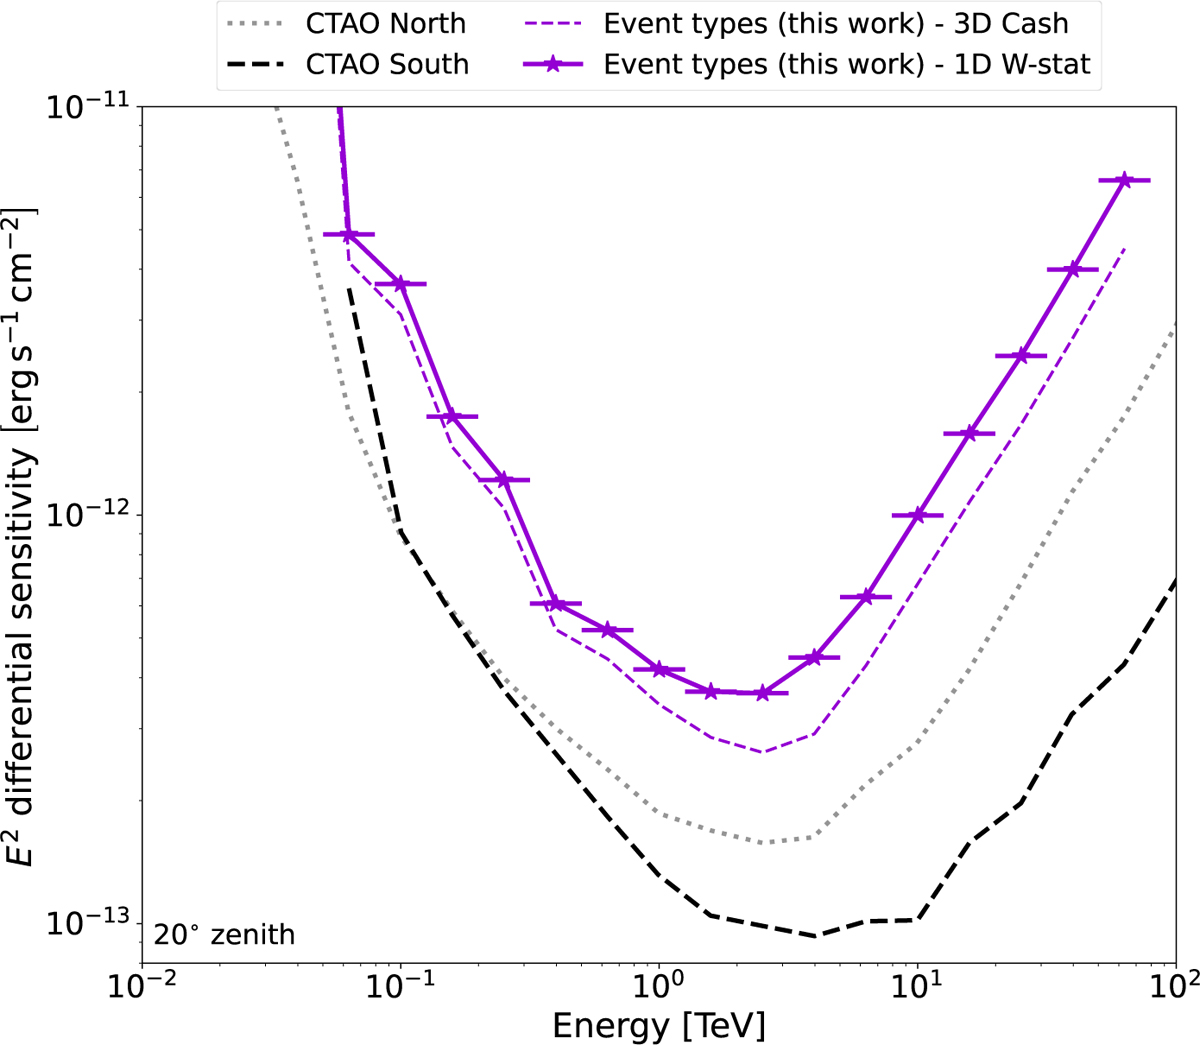
Differential sensitivity as a function of energy for a representative zenith angle of 20◦. The sensitivities for Event types using 3D Cash statistics (dashed purple line) and 1D W-statistics (full purple line with stars) are compared to the projected sensitivities for CTAO North (dotted gray line) and CTAO South (full black line) (Cherenkov Telescope Array Observatory and Cherenkov Telescope Array Consortium 2021).
Current usage metrics show cumulative count of Article Views (full-text article views including HTML views, PDF and ePub downloads, according to the available data) and Abstracts Views on Vision4Press platform.
Data correspond to usage on the plateform after 2015. The current usage metrics is available 48-96 hours after online publication and is updated daily on week days.
Initial download of the metrics may take a while.