Fig. 4
Download original image
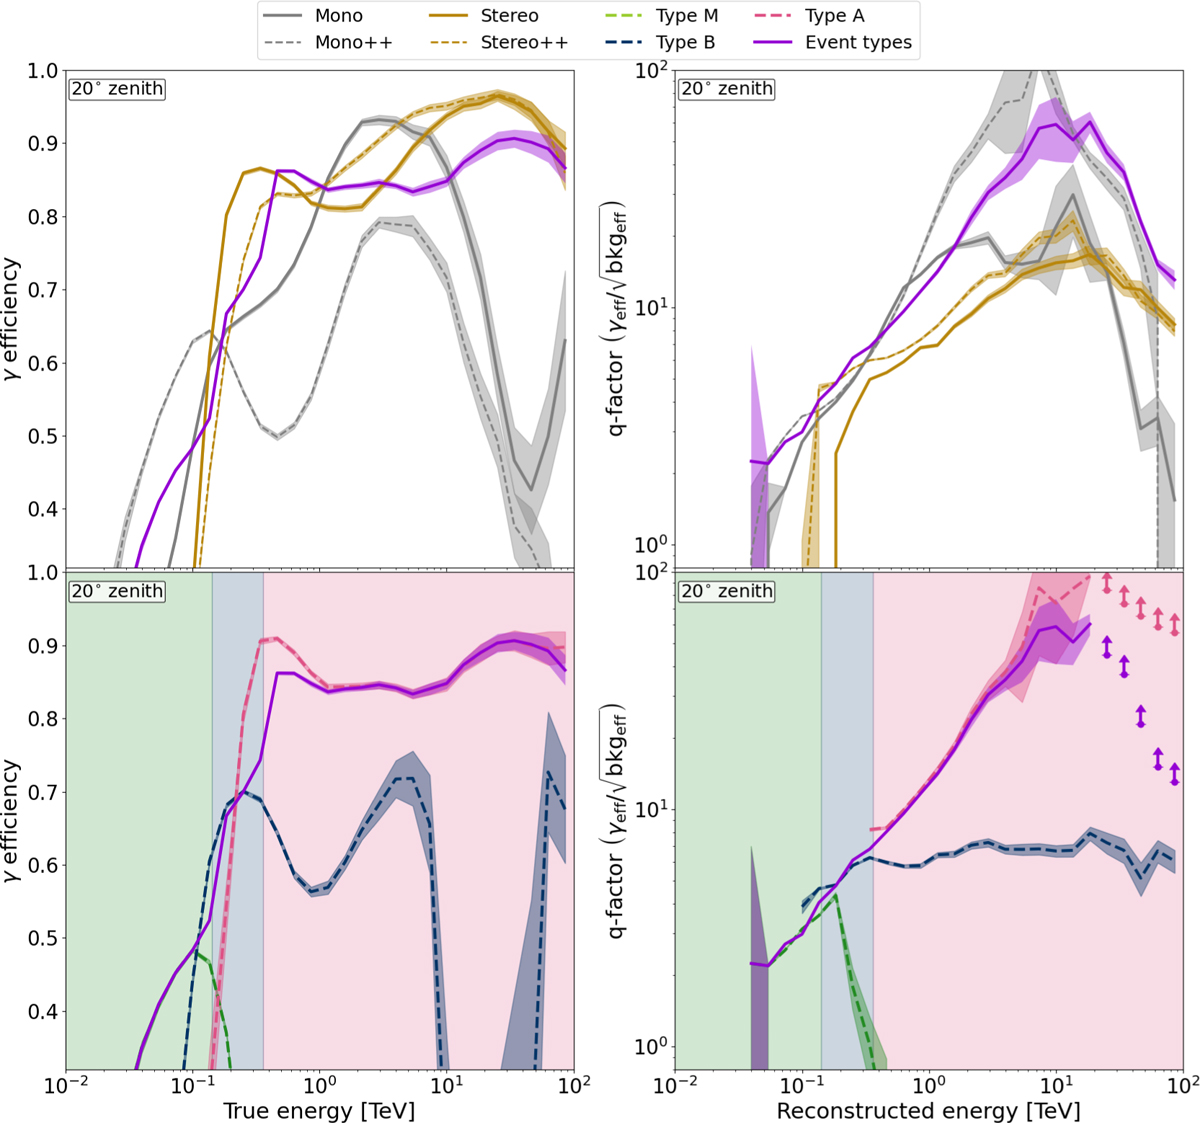
Separation efficiencies as a function of energy for a representative zenith angle of 20◦. The left panels show the gamma efficiency, γeff, as a function of true energy. The right panels show the q-factor, ![]() , as a function of reconstructed energy (as real data were used for the background, true energy is not defined). In the top panels, Event types (full purple line) is compared to the standard configurations of HAP, Mono (full gray line), and Stereo (full orange line) and to the intermediate configurations with the old definition and new improvements, Mono++ (dashed gray line) and Stereo++ (dashed orange line). In the bottom panels, Event types is compared to the individual types: Type M (full green line), Type B (full blue line), and Type A (full magenta line). The uncertainties are calculated via bootstrapping and are shown as shaded regions around the lines. The shaded areas in the bottom panel show the energy range in which each type dominates the joint analysis. The combined efficiency for Event types was calculated as discussed in Section 4.2.
, as a function of reconstructed energy (as real data were used for the background, true energy is not defined). In the top panels, Event types (full purple line) is compared to the standard configurations of HAP, Mono (full gray line), and Stereo (full orange line) and to the intermediate configurations with the old definition and new improvements, Mono++ (dashed gray line) and Stereo++ (dashed orange line). In the bottom panels, Event types is compared to the individual types: Type M (full green line), Type B (full blue line), and Type A (full magenta line). The uncertainties are calculated via bootstrapping and are shown as shaded regions around the lines. The shaded areas in the bottom panel show the energy range in which each type dominates the joint analysis. The combined efficiency for Event types was calculated as discussed in Section 4.2.
Current usage metrics show cumulative count of Article Views (full-text article views including HTML views, PDF and ePub downloads, according to the available data) and Abstracts Views on Vision4Press platform.
Data correspond to usage on the plateform after 2015. The current usage metrics is available 48-96 hours after online publication and is updated daily on week days.
Initial download of the metrics may take a while.