Fig. 9
Download original image
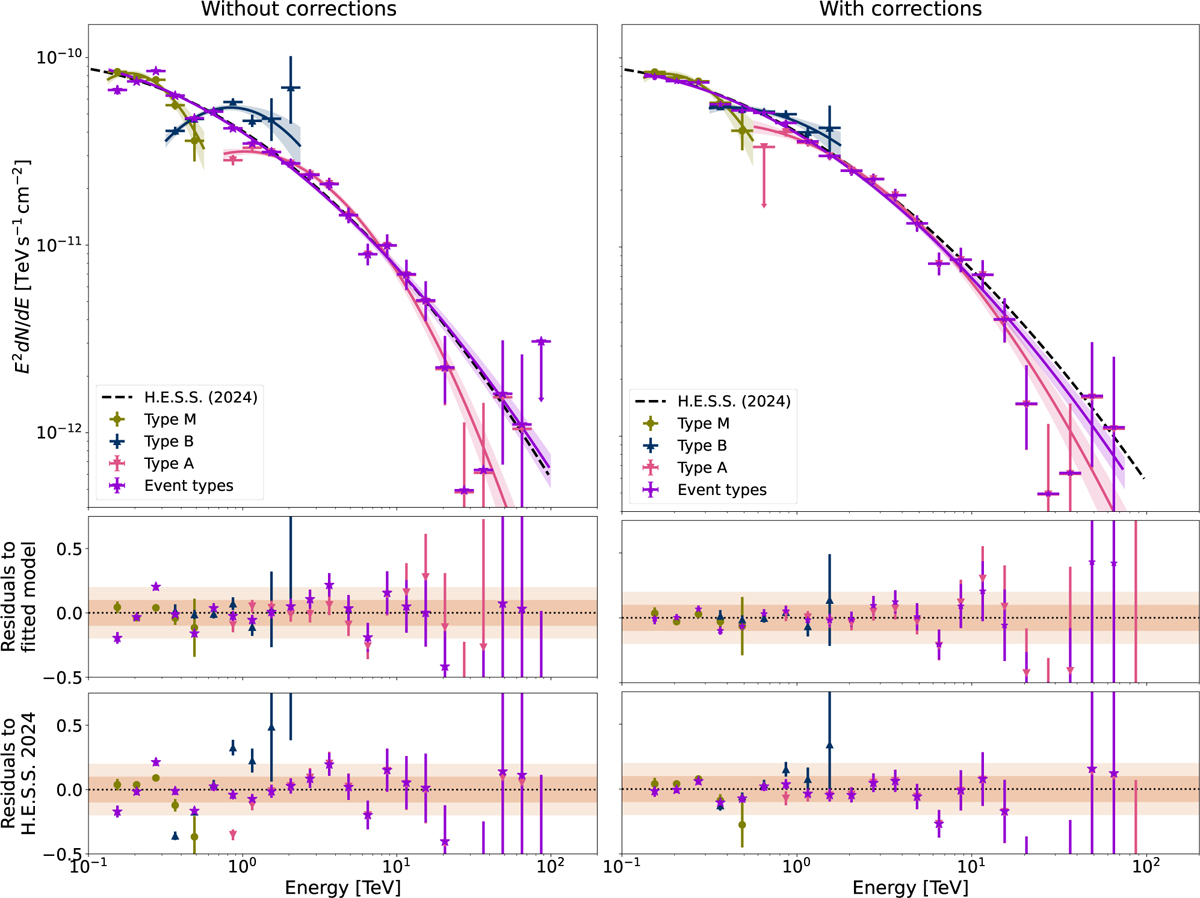
Reconstructed spectral energy distribution of the Crab nebula without (left) and with (right) run-by-run correction for the observation conditions. We show spectra for each individual type, Type M (green lines with full circles), Type B (blue lines with full upward-pointing triangles), and Type A (magenta lines with full downward-pointing triangles), as well as the combined spectrum, Event types (purple lines with stars). The full lines show the best-fit model, and the shaded areas show their statistical uncertainty ranges. The dashed black line shows the best-fit model from Aharonian et al. (2024) as a comparison. The center and bottom panels show the residual to the best-fit model of each configuration and to the model of Aharonian et al. (2024), respectively. The dark and light brown bands show the ±10% and ±20% ranges.
Current usage metrics show cumulative count of Article Views (full-text article views including HTML views, PDF and ePub downloads, according to the available data) and Abstracts Views on Vision4Press platform.
Data correspond to usage on the plateform after 2015. The current usage metrics is available 48-96 hours after online publication and is updated daily on week days.
Initial download of the metrics may take a while.