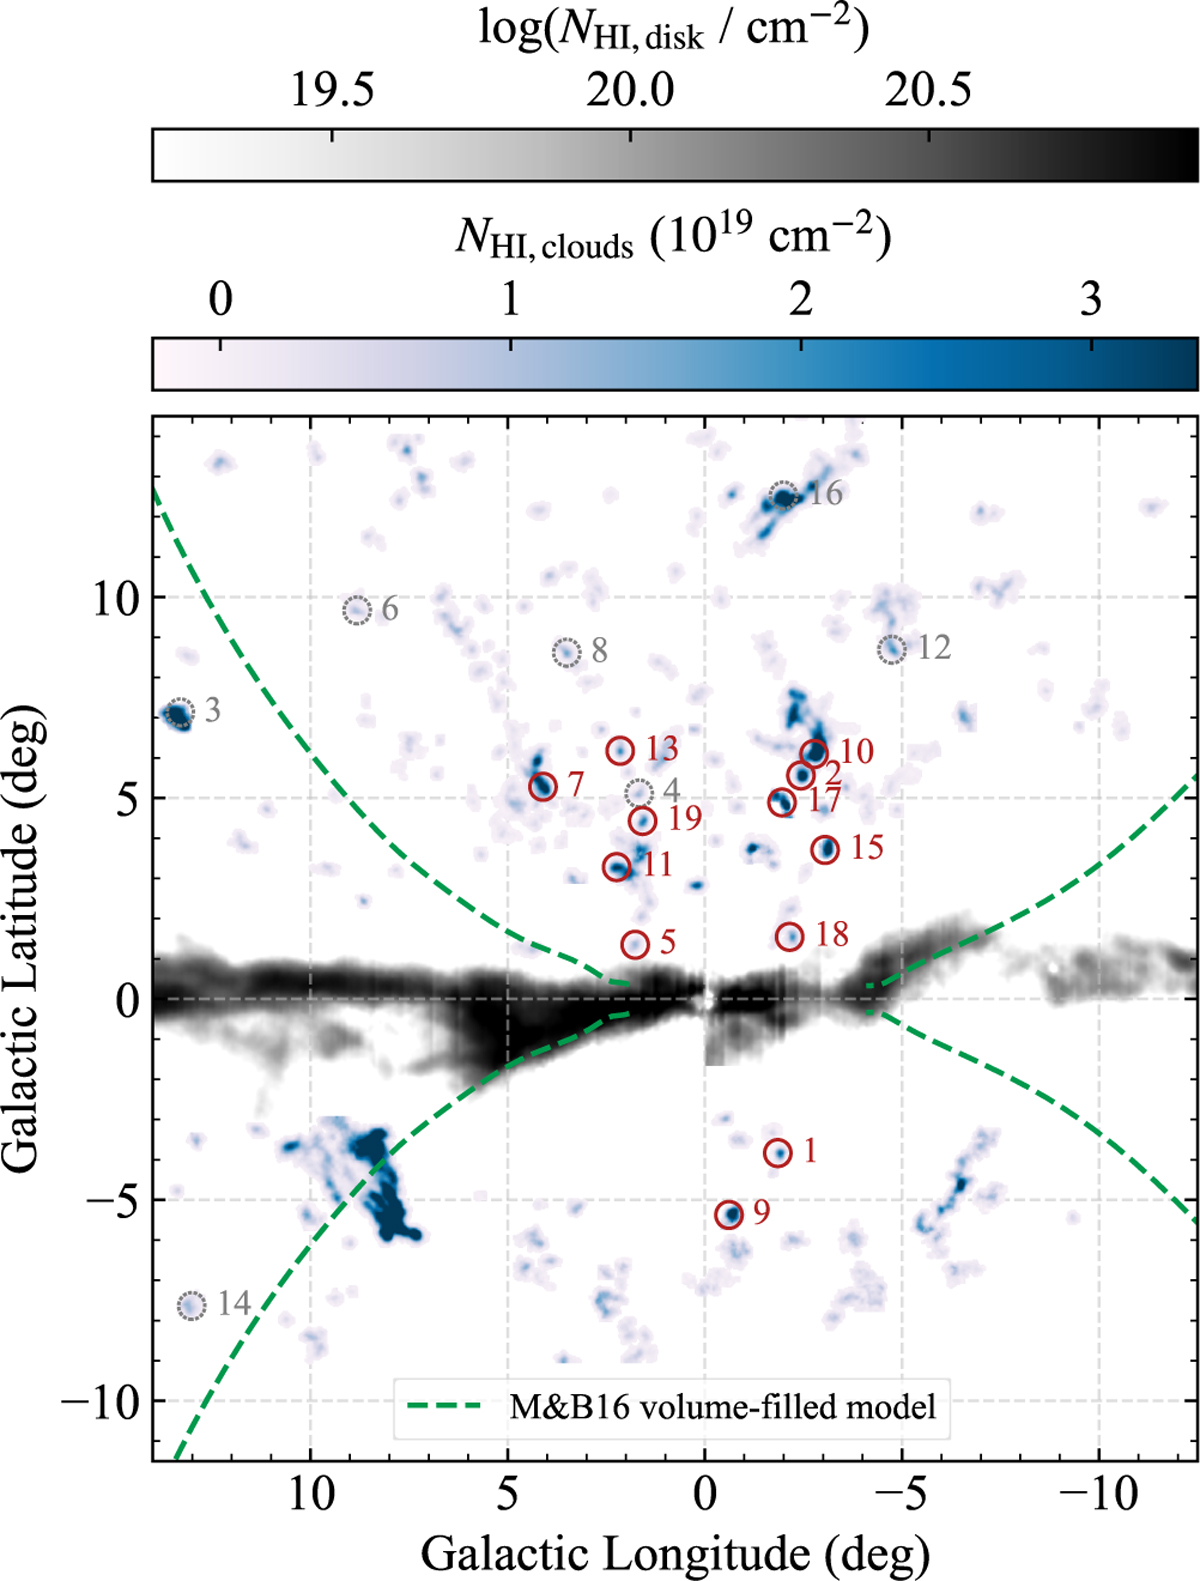
Fig. 1
Download original image
Sample of high-velocity clouds studied in this work. The grayscale map represents the MW disk (Lockman & McClure-Griffiths 2016) and the blue color-scale map the outflowing Hi high-velocity clouds (Di Teodoro et al. 2018). Red circles mark the clouds followed- up in the 12CO(2→1) and 12CO(4→3) lines with APEX and analyzed in this work, numbered as in Table 1. Dotted gray circles denote clouds not detected in CO emission.
Current usage metrics show cumulative count of Article Views (full-text article views including HTML views, PDF and ePub downloads, according to the available data) and Abstracts Views on Vision4Press platform.
Data correspond to usage on the plateform after 2015. The current usage metrics is available 48-96 hours after online publication and is updated daily on week days.
Initial download of the metrics may take a while.