Fig. 2
Download original image
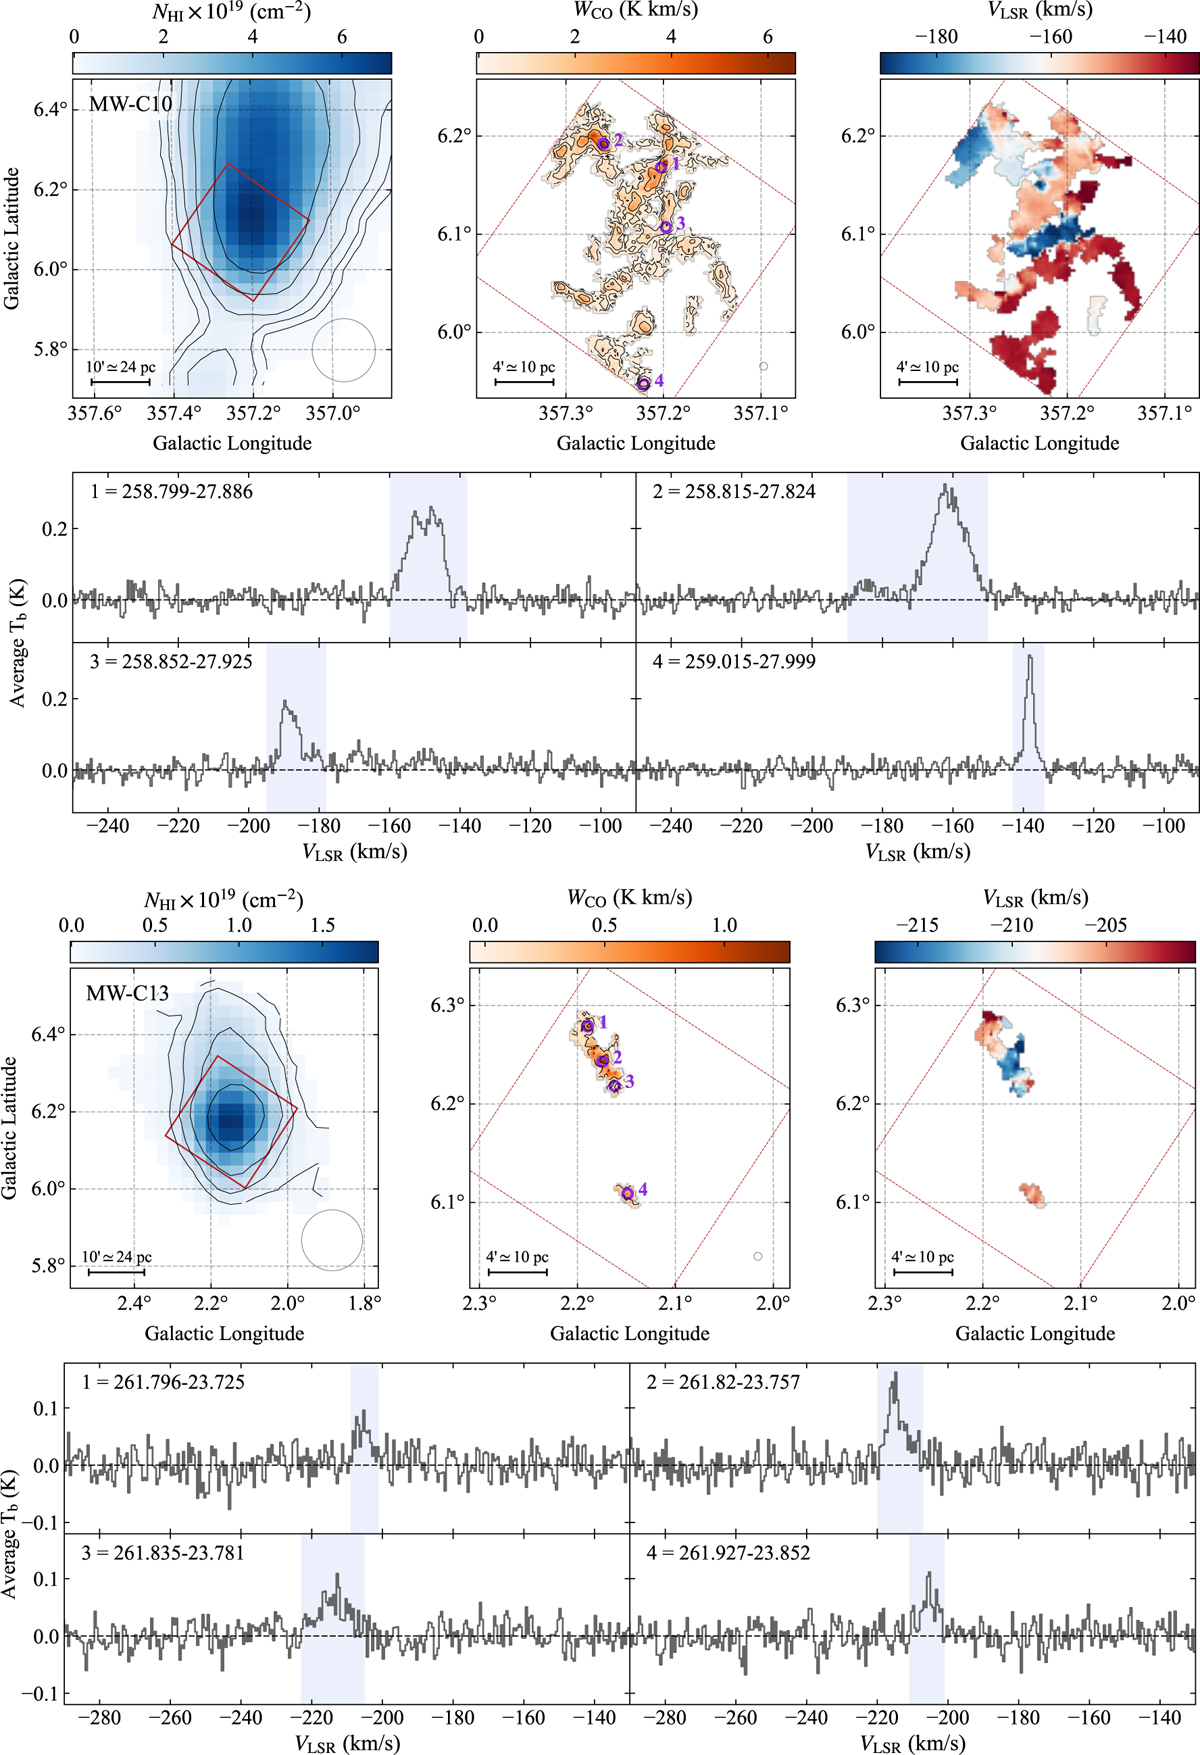
Moment maps and example spectra for two clouds (MW-C10 and MW-C13). For each cloud, we show the Hi column density map (left, blue color-scale) from GBT data, the CO total intensity map (center, orange color-scale) and the CO velocity map (right, spectral color-scale). The red squares denote the field observed in CO with APEX. Beam sizes for the GBT and APEX data are indicated as gray circles in the bottom right corner of the Hi and CO maps, respectively. Spectra are extracted from the positions indicated on the CO total maps, with radius equal to the APEX beam size. Shaded blue bands in the spectra denote the velocity range of the detection. Contour levels in the Hi and CO maps are at S/N levels of 2.5, 5, 10, 20 and 40.
Current usage metrics show cumulative count of Article Views (full-text article views including HTML views, PDF and ePub downloads, according to the available data) and Abstracts Views on Vision4Press platform.
Data correspond to usage on the plateform after 2015. The current usage metrics is available 48-96 hours after online publication and is updated daily on week days.
Initial download of the metrics may take a while.