Fig. 3
Download original image
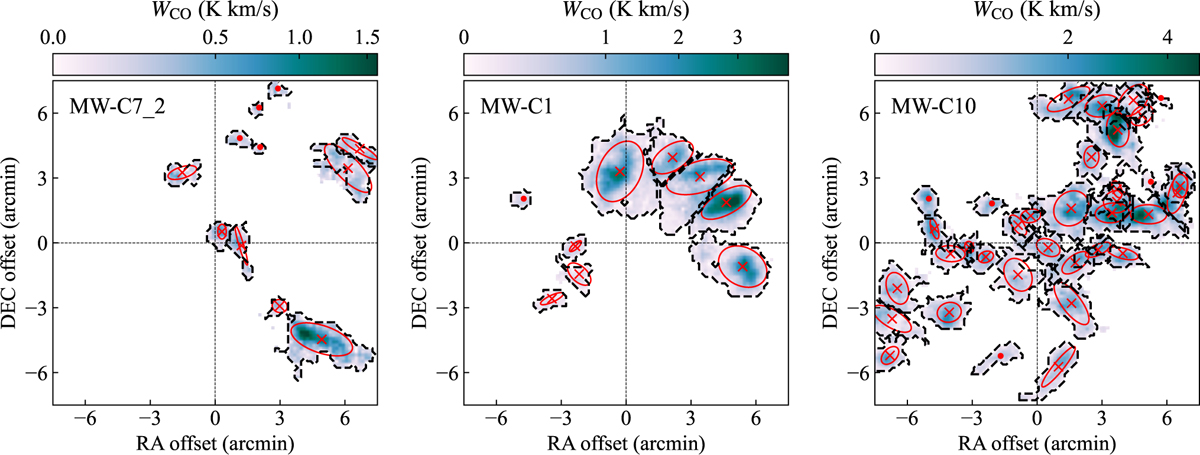
Cloud segmentation for three clouds in our sample: MW-C7_2 (left), MW-C1 (center) and MW-C10 (right). The blue-green color maps show the masked 12CO(2→1) integrated intensity maps. The dashed black contours denote the projected boundaries of each clump. The red crosses and ellipses show the emission centroid and an elliptical approximation of the emission in each clump. These ellipses represent a rough estimate of the size and orientation of the molecular clumps obtained through beam deconvolution. Clumps that could not be deconvolved are indicated as a filled dot. These clumps are not included in the analysis.
Current usage metrics show cumulative count of Article Views (full-text article views including HTML views, PDF and ePub downloads, according to the available data) and Abstracts Views on Vision4Press platform.
Data correspond to usage on the plateform after 2015. The current usage metrics is available 48-96 hours after online publication and is updated daily on week days.
Initial download of the metrics may take a while.