Fig. 4
Download original image
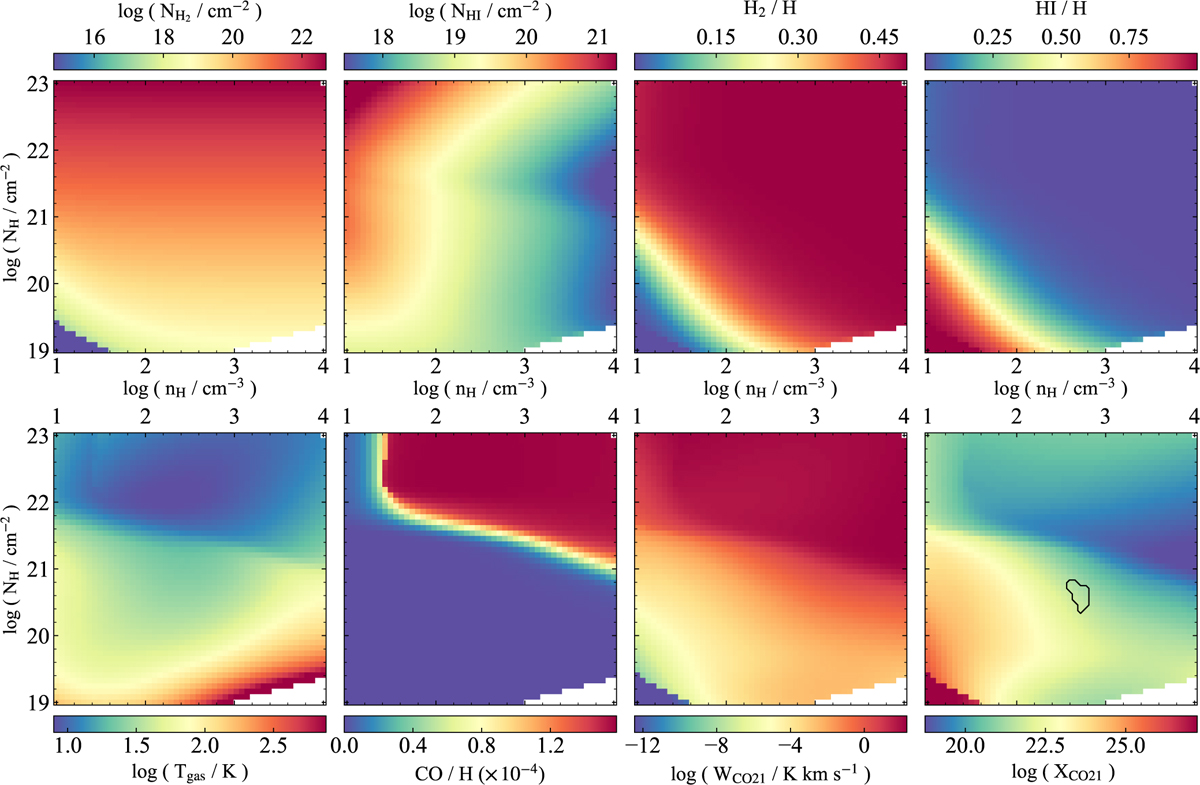
DESPOTIC results for a model with σturb = 3 km s−1, 𝒳; = 𝒳;0, ζ = 10−16 s−1 and solar dust abundance. Top panels, from left to right: predicted H2 column density, Hi column density, H2 and Hi abundances per H nucleus. Bottom panels, from left to right: Gas temperature, CO abundance per H nucleus, integrated brightness temperature and CO-to-H2 conversion factor for the 12CO(2→1) emission line. Blank pixels denote regions of the grid where the models did not converge. The black contours on the XCO plot represent an example of the constraint on the parameter space given by our data for MW-C1. Similar radiative-transfer models are used to calculate fiducial conversion factors within each Hi cloud.
Current usage metrics show cumulative count of Article Views (full-text article views including HTML views, PDF and ePub downloads, according to the available data) and Abstracts Views on Vision4Press platform.
Data correspond to usage on the plateform after 2015. The current usage metrics is available 48-96 hours after online publication and is updated daily on week days.
Initial download of the metrics may take a while.