Fig. 6
Download original image
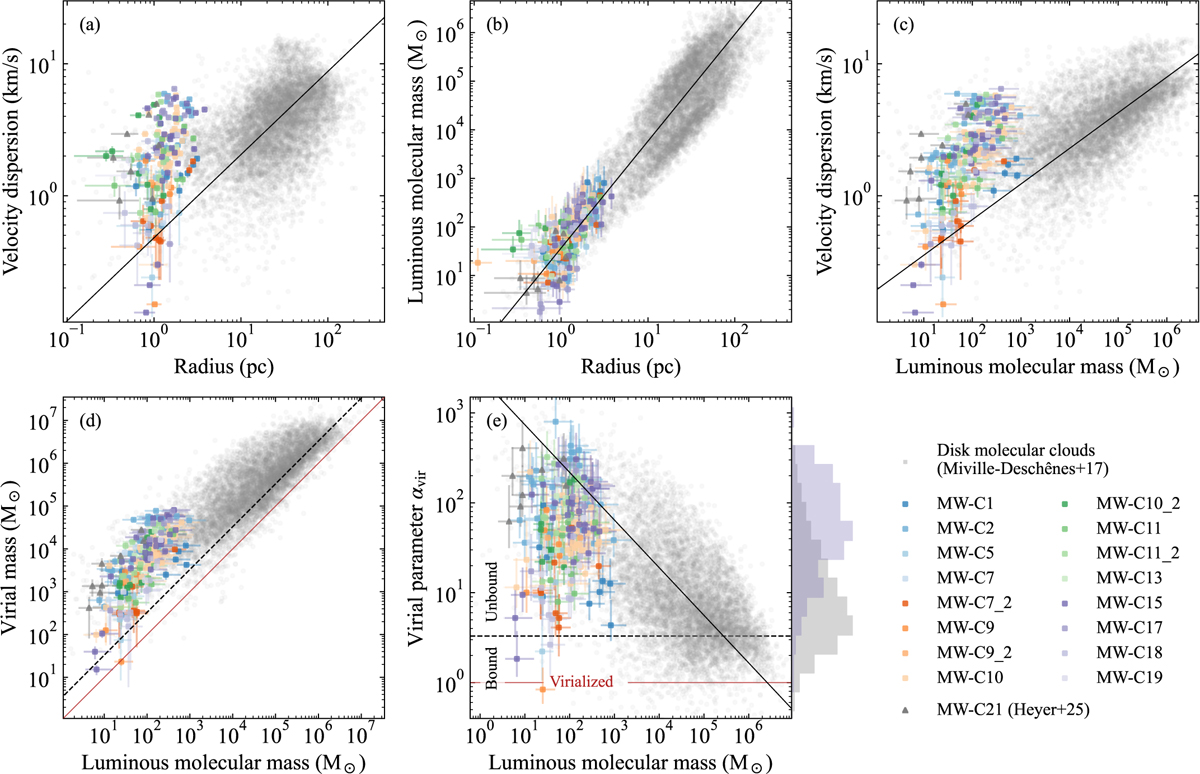
Scaling relations of molecular clouds in the MW wind compared to molecular clouds in the MW disk. In all panels, gray dots indicate the MW disk sample from MD17, the points are the wind clumps studied in this paper from APEX data, color-coded by their parent Hi cloud, while the dark gray triangles are for the MW-C21 cloud from LMT data (Heyer et al. 2025). Full black lines denote the best-fit relations to the disk sample from MD17. Panel (a) σv–R relation, best-fit σv = 0.48R0.63; (b) Mmol–R relation, best-fit Mmol = 36.7R2.2; (c) σv–Mmol relation, best-fit ![]() ; (d) Mvir vs. Mmol; (e) αvir vs. Mmol, best-fit
; (d) Mvir vs. Mmol; (e) αvir vs. Mmol, best-fit ![]() . In panels (d) and (e), the full red line denotes a virialized cloud (Mmol = Mvir), while the dashed black line indicates the αvir = 3.3 boundary between gravitationally bound and unbound clouds. The histograms on the y axis of panel (e) show normalized distributions of αvir marginalized over Mmol for disk clouds (gray) and wind clouds (purple). The extremely large virial parameters, driven by the large velocity dispersions, imply that the clouds are not gravitationally bound.
. In panels (d) and (e), the full red line denotes a virialized cloud (Mmol = Mvir), while the dashed black line indicates the αvir = 3.3 boundary between gravitationally bound and unbound clouds. The histograms on the y axis of panel (e) show normalized distributions of αvir marginalized over Mmol for disk clouds (gray) and wind clouds (purple). The extremely large virial parameters, driven by the large velocity dispersions, imply that the clouds are not gravitationally bound.
Current usage metrics show cumulative count of Article Views (full-text article views including HTML views, PDF and ePub downloads, according to the available data) and Abstracts Views on Vision4Press platform.
Data correspond to usage on the plateform after 2015. The current usage metrics is available 48-96 hours after online publication and is updated daily on week days.
Initial download of the metrics may take a while.