Fig. 7
Download original image
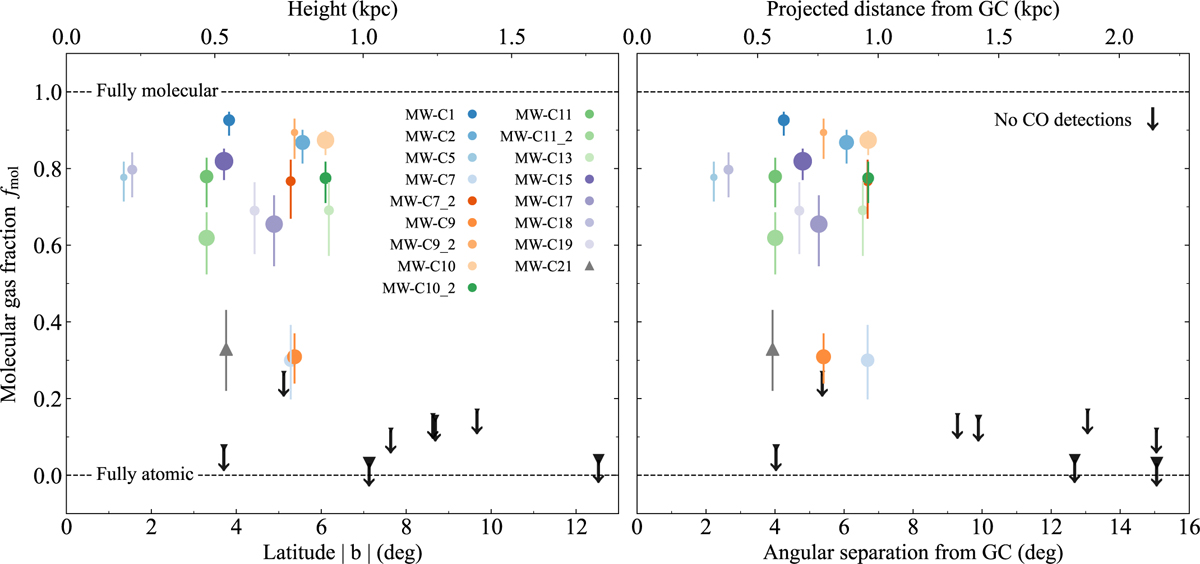
Molecular gas fraction as a function of latitude or height (left panel) and as a function of angular separation or projected distance from the GC (right panel). Points denote the CO detections, color-coded as in Figure 6. Up-down triangles with arrows represents observed Hi clouds with no CO detections, for which we estimate molecular mass upper limits (see Section 3.4). The size of all markers is proportional to the peak Hi column density of the cloud, ranging from 5 × 1018 cm−2 to 8 × 1019 cm−2.
Current usage metrics show cumulative count of Article Views (full-text article views including HTML views, PDF and ePub downloads, according to the available data) and Abstracts Views on Vision4Press platform.
Data correspond to usage on the plateform after 2015. The current usage metrics is available 48-96 hours after online publication and is updated daily on week days.
Initial download of the metrics may take a while.