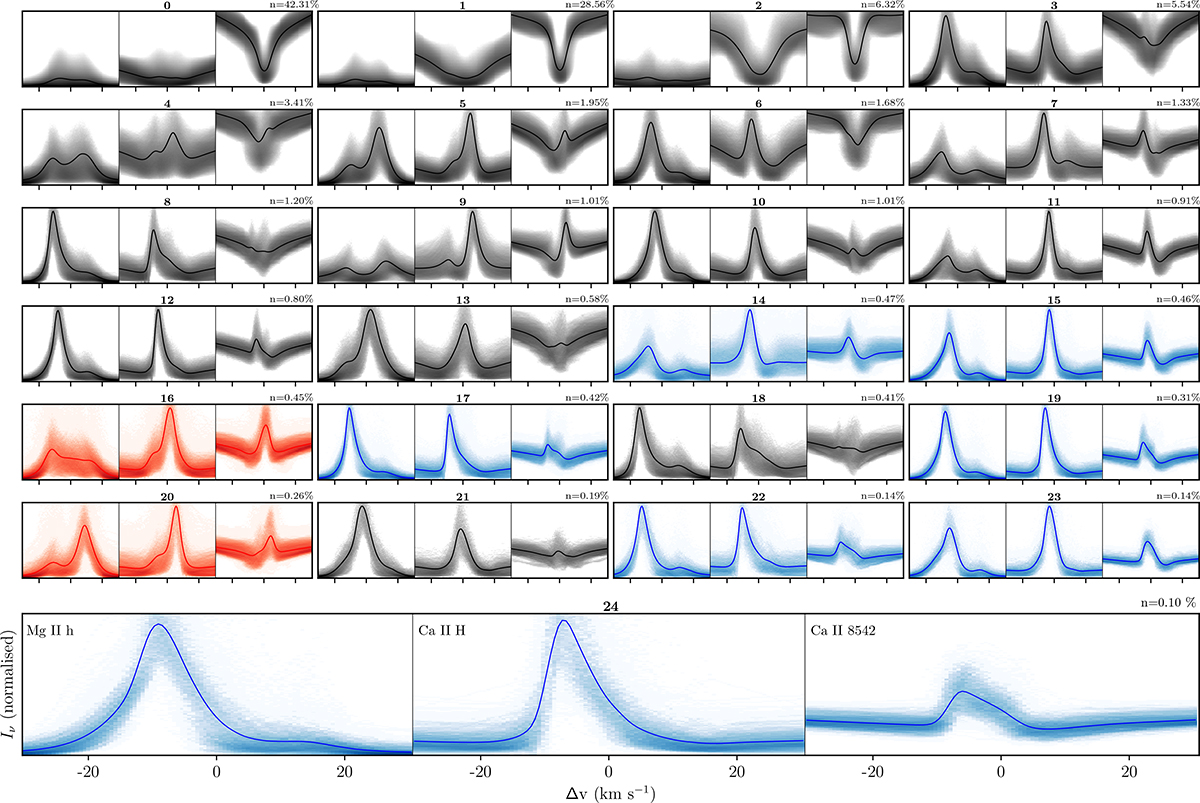
Fig. 1.
Download original image
Simultaneous k-means clustering for the chromospheric Mg II h, Ca II H, and Ca II 8542 Å spectral lines. The clusters, labelled in bold, are ranked from most common in the top to least common in the bottom. The fraction of profiles in each cluster is labelled in the top right of each panel. The spectra are interpolated to a constant velocity separation for Doppler velocity between between ±30 km s−1. Clusters of interest are divided into two classes: blue grains, plotted with blue; and red grains, plotted with red. In the figure, all clusters are normalised separately, but the scaling between the three lines in each cluster is preserved.
Current usage metrics show cumulative count of Article Views (full-text article views including HTML views, PDF and ePub downloads, according to the available data) and Abstracts Views on Vision4Press platform.
Data correspond to usage on the plateform after 2015. The current usage metrics is available 48-96 hours after online publication and is updated daily on week days.
Initial download of the metrics may take a while.